DevSecOps Project 1: Deployment of Netflix Clone Application

As a final year undergraduate with a passion for Cloud DevOps Engineering, I bring a strong foundation in cloud computing and automation to the table. I have a solid understanding of cloud platforms such as AWS or Google Cloud and have honed my skills in infrastructure as code (IaC) using tools like Terraform and CloudFormation. I am eager to apply my knowledge of CI/CD pipelines, containerization, and version control systems to contribute to efficient and automated software development processes. I am a quick learner, highly motivated, and excited to embark on a career in Cloud & DevOps, where I can leverage my technical expertise to drive innovation and streamline operations.
In addition to my proficiency in cloud technologies, I bring a wealth of experience in crafting efficient CI/CD pipelines, implementing containerization strategies, and managing version control systems. My eagerness to learn, coupled with my inherent motivation, fuels my drive to continually enhance processes and drive innovation in software development.
I am poised to make a significant impact in Cloud, DevOps and DevSecOps leveraging my technical prowess to streamline operations and catalyze organizational growth.
Well i am a part-time competitive Coder too, I have a solid understanding of Data Structure and Algorithms as well as of Object Oriented Programming. I usually code in C++ and have the familiarity with Java and Python as well as i also have the intermediate knowledge of Rust Programming language too. Some of my coding achievements are 5🌟 @HackerRank || 4🌟 @CodeChef(Max.Rating->1845) || Knight🔰 @LeetCode(Max.Rating->1858).
Along with all these stuffs i have the understanding of Cloud Platforms like Amazon Web Services (AWS) and Google Cloud Platform (GCP). I was also a Google Cloud's Arcade Facilitator in 2k23 where i had mentored 150+ student's and professional's in gaining knowledge about the Google Cloud Platform (GCP). Moreover I had also won some of the Google Cloud's events like Google CRFP'22 || Google CCP'23.
Hey Everyone, we will be deploying a Netflix clone. We will be using Jenkins as a CI/CD tool for deploying our application on a Docker Container and on Kubernetes Cluster and we will monitor the Jenkins and Kubernetes metrics using Grafana, Prometheus and Node exporter. So, let's get started.
Steps:-
Step 1 —> Launch an Ubuntu(22.04) T2 Large Instance
Step 2 —> Install Jenkins, Docker and Trivy. Create a Sonarqube Container using Docker.
Step 3 —> Create a TMDB API Key.
Step 4 —> Install Prometheus and Grafana On the new Server.
Step 5 —> Install the Prometheus Plugin and Integrate it with the Prometheus server.
Step 6 —> Email Integration With Jenkins and Plugin setup.
Step 7 —> Install Plugins like JDK, Sonarqube Scanner, Nodejs, and OWASP Dependency Check.
Step 8 —> Create a Pipeline Project in Jenkins using a Declarative Pipeline
Step 9 —> Install OWASP Dependency Check Plugins
Step 10 —> Docker Image Build and Push
Step 11 —> Deploy the image using Docker
Step 12 —> Kubernetes Master and Slave server setup on Ubuntu (20.04)
Step 13 —> Access the Netflix app on the Browser.
Step 14 —> Terminate the AWS EC2 Instances.
Now, let's start implementing each step mentioned above...!!
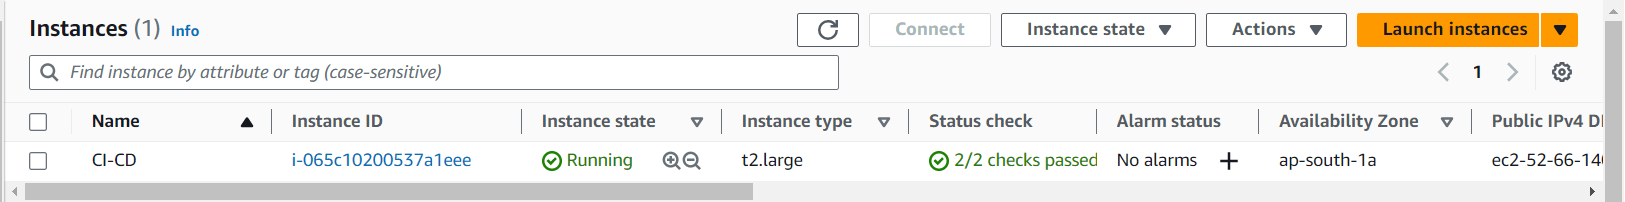
Step 1: Launch an Ubuntu(22.04) T2 Large Instance:-
Launch an AWS t2.large Instance. Use the image as Ubuntu. You can create a new key pair or use an existing one. Enable HTTP and HTTPS settings in the Security Group and open all ports.
Step 2: Install Jenkins, Docker and Trivy:-
2A:- Install Jenkins
sudo wget -O /usr/share/keyrings/jenkins-keyring.asc \
  https://pkg.jenkins.io/debian-stable/jenkins.io-2023.key
echo deb [signed-by=/usr/share/keyrings/jenkins-keyring.asc] \
  https://pkg.jenkins.io/debian-stable binary/ | sudo tee \
  /etc/apt/sources.list.d/jenkins.list > /dev/null
sudo apt-get update
sudo apt-get install jenkins

sudo apt update
sudo apt install openjdk-17-jdk
sudo apt install openjdk-17-jre

sudo systemctl enable jenkins
sudo systemctl start jenkins
sudo systemctl status jenkins
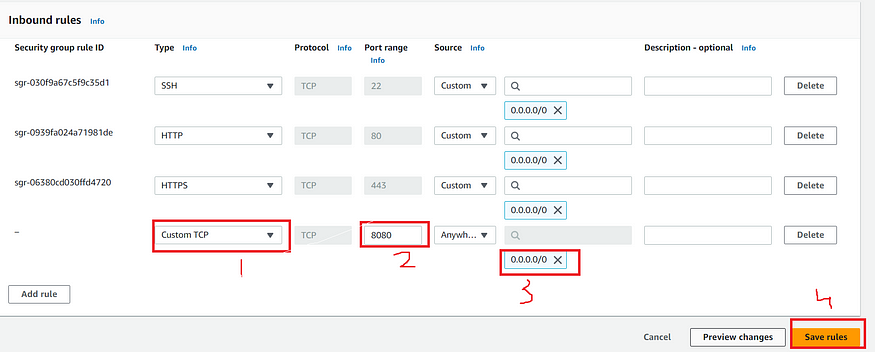
Once the Jenkins is installed, go to your AWS EC2 Security Group and open Inbound Port 8080, since Jenkins works on default Port 8080.
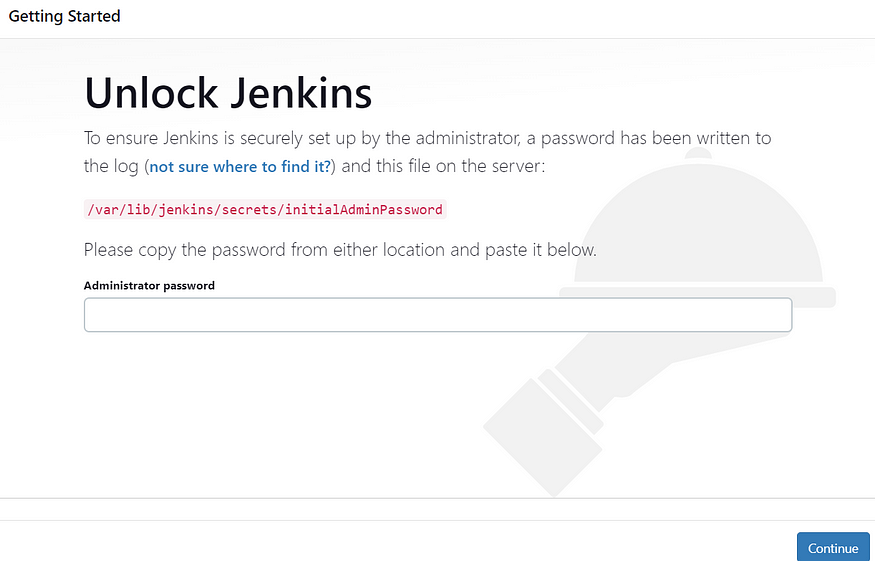
Now, copy your public IP address of your instance, and use the below command to get your password of Jenkins
<EC2 Public IP Address:8080>
sudo cat /var/lib/jenkins/secrets/initialAdminPassword
Unlock Jenkins using an administrative password and install the required plugins.
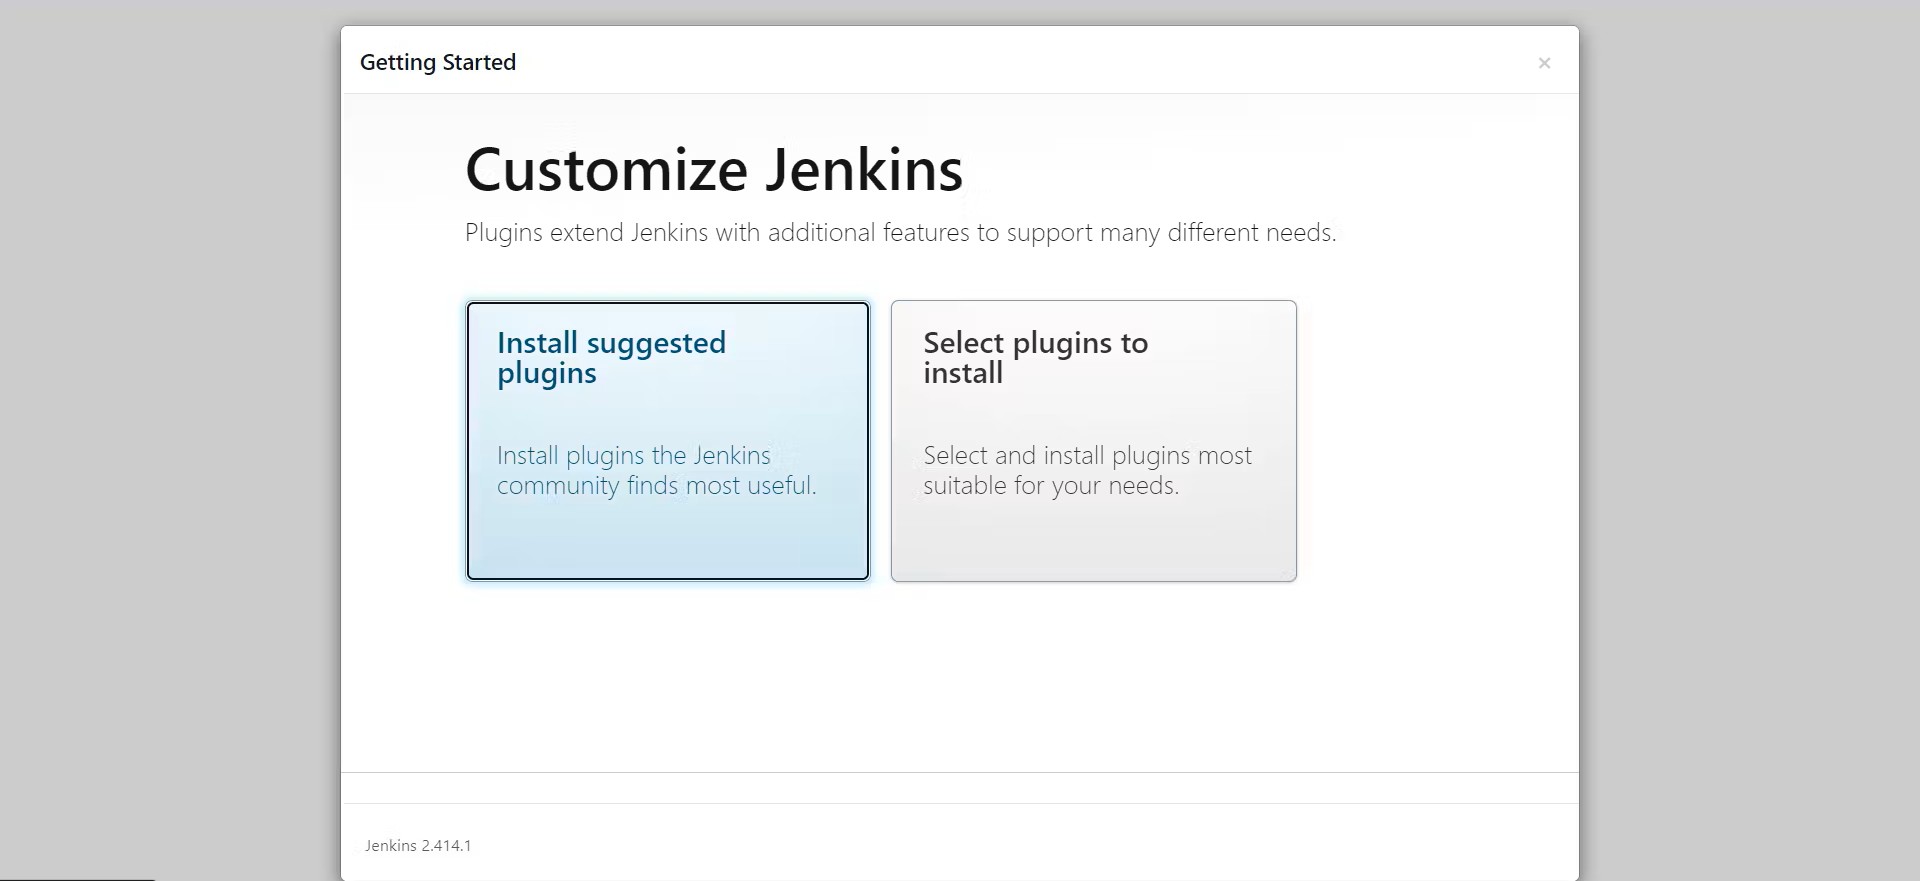
Jenkins will now get installed and install with all the libraries.
Now, Create a user, then click on save and continue.
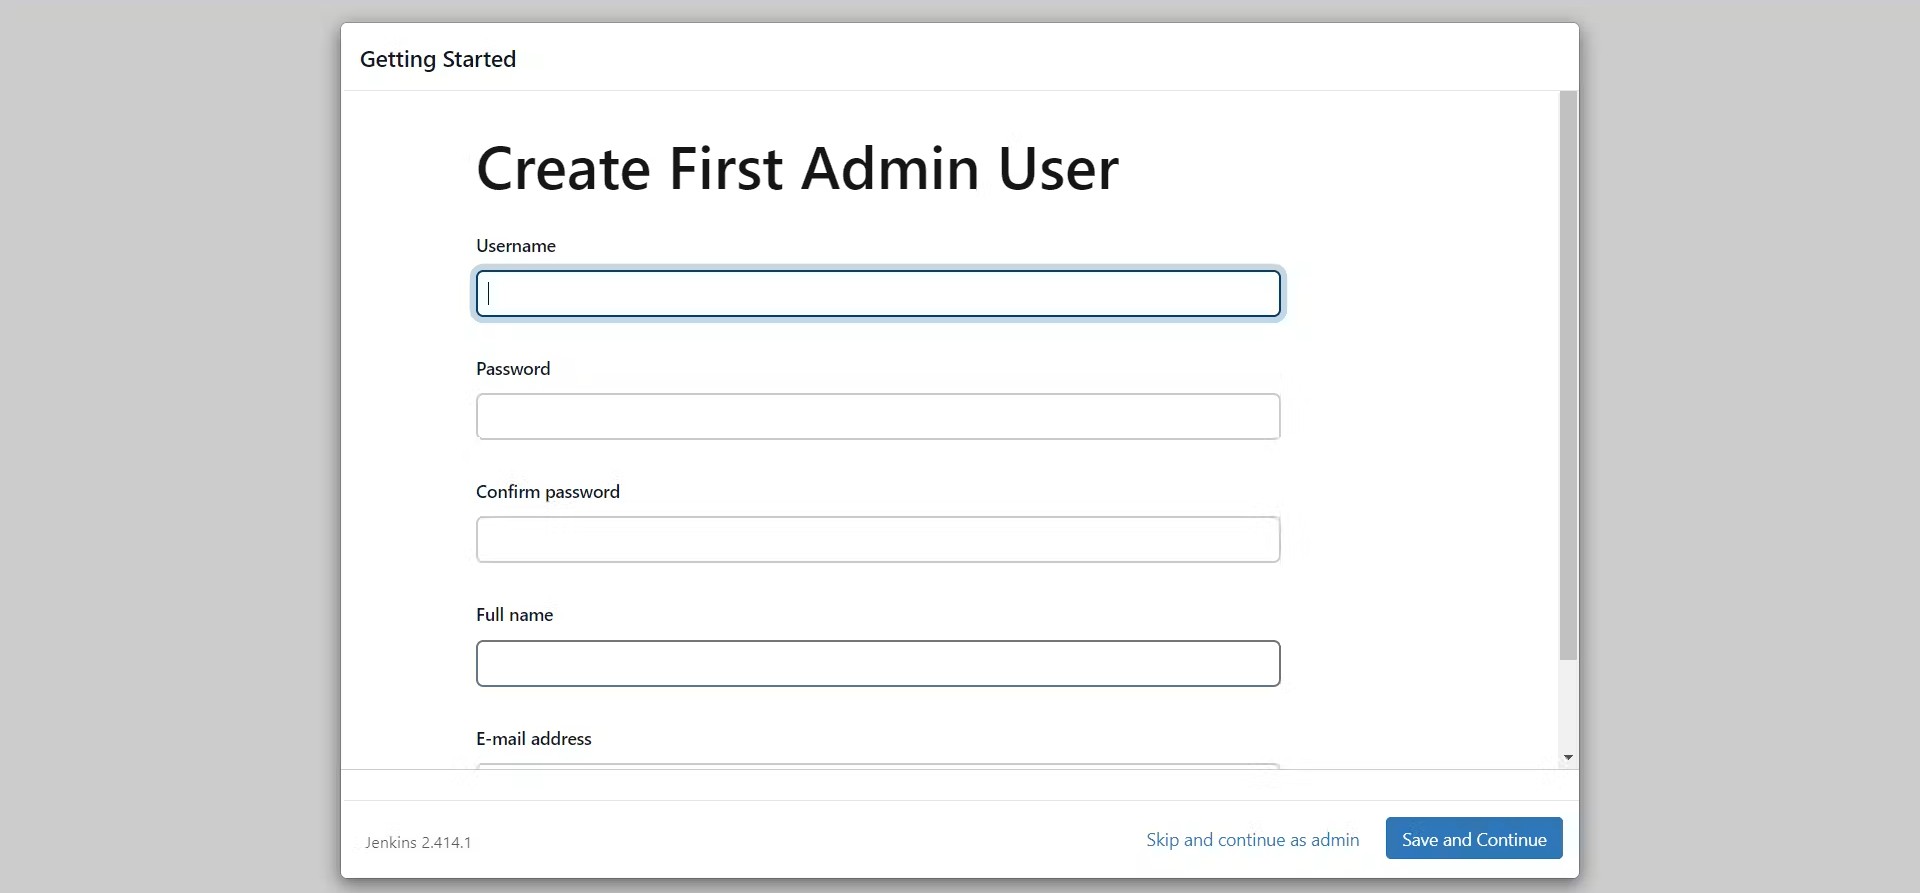
Jenkins Getting Started Screen.
2B:- Install Docker
sudo apt-get update
sudo apt-get install docker.io -y
sudo usermod -aG docker $USER   #my case is ubuntu
newgrp docker
sudo chmod 777 /var/run/docker.sock
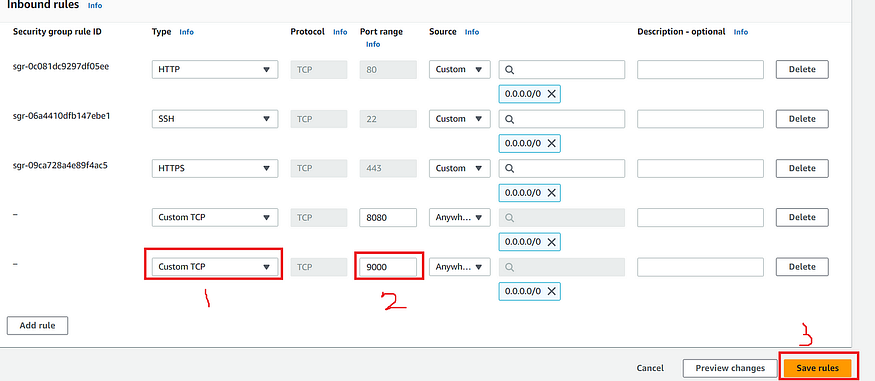
After the docker installation, we create a SonarQube container, and do remember to add 9000 port in the security group.
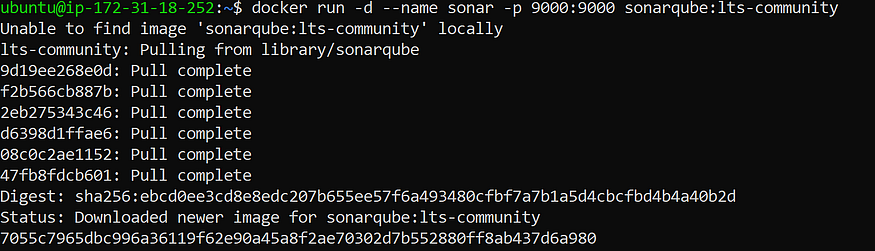
Now, Install SonarQube using the below command
docker run -d --name sonar -p 9000:9000 sonarqube:lts-community
The output you will get after running the above SonarQube installation command is:-
Now, you can access the SonarQube on browser like this:-
<EC2 Public IP Address:9000>
Now, the SonarQube is up and running and default username and password of SonarQube is admin
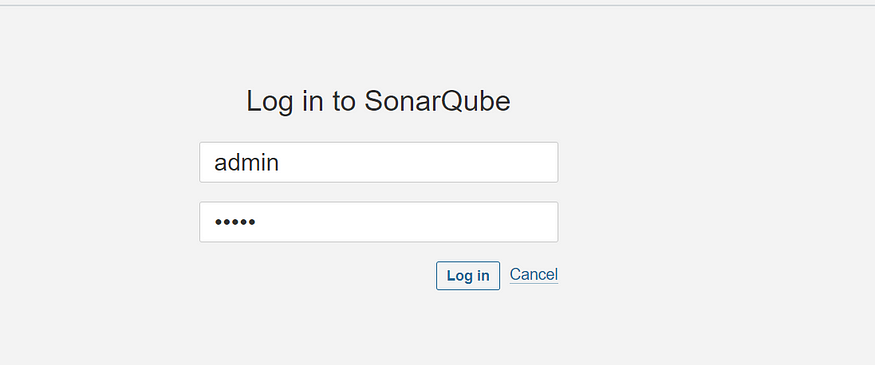
Enter username and password, click on login and change password:-
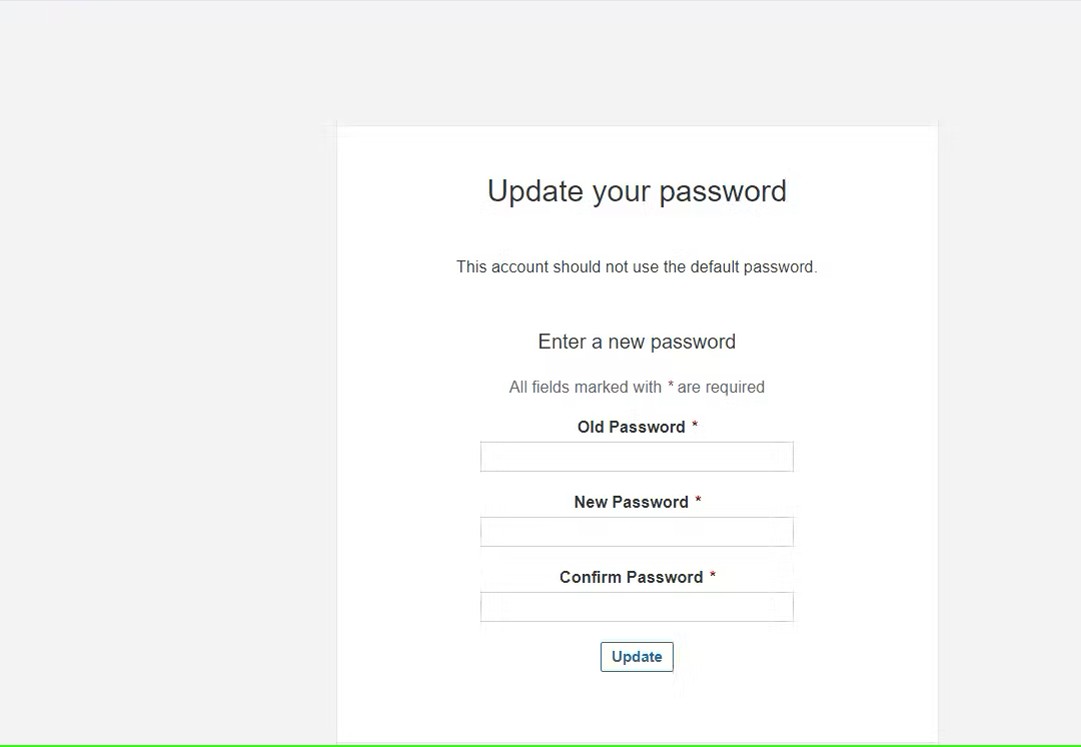
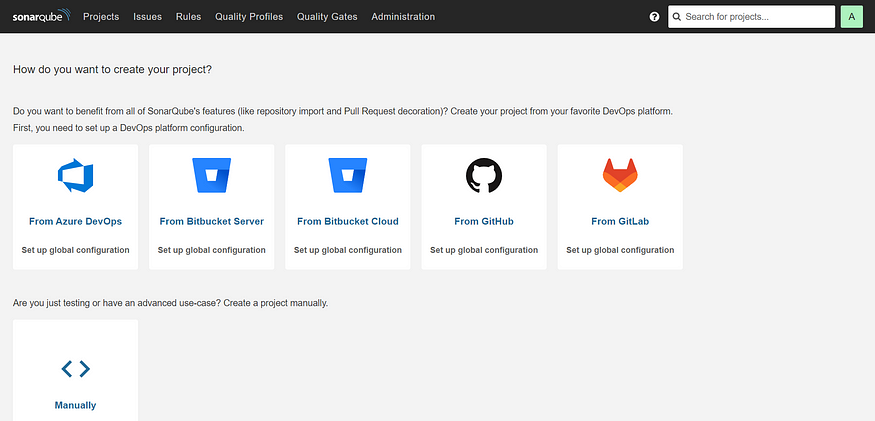
Now, after updating the New password, you can view this SonarQube dashboard:-
2C:- Install Trivy
sudo apt-get install wget apt-transport-https gnupg lsb-release -y
wget -qO - https://aquasecurity.github.io/trivy-repo/deb/public.key | gpg --dearmor | sudo tee /usr/share/keyrings/trivy.gpg > /dev/null
echo "deb [signed-by=/usr/share/keyrings/trivy.gpg] https://aquasecurity.github.io/trivy-repo/deb $(lsb_release -sc) main" | sudo tee -a /etc/apt/sources.list.d/trivy.list
sudo apt-get update
sudo apt-get install trivy -y
Step 3: Create a TMDB API Key
Open a new tab in the Browser and search for TMDB
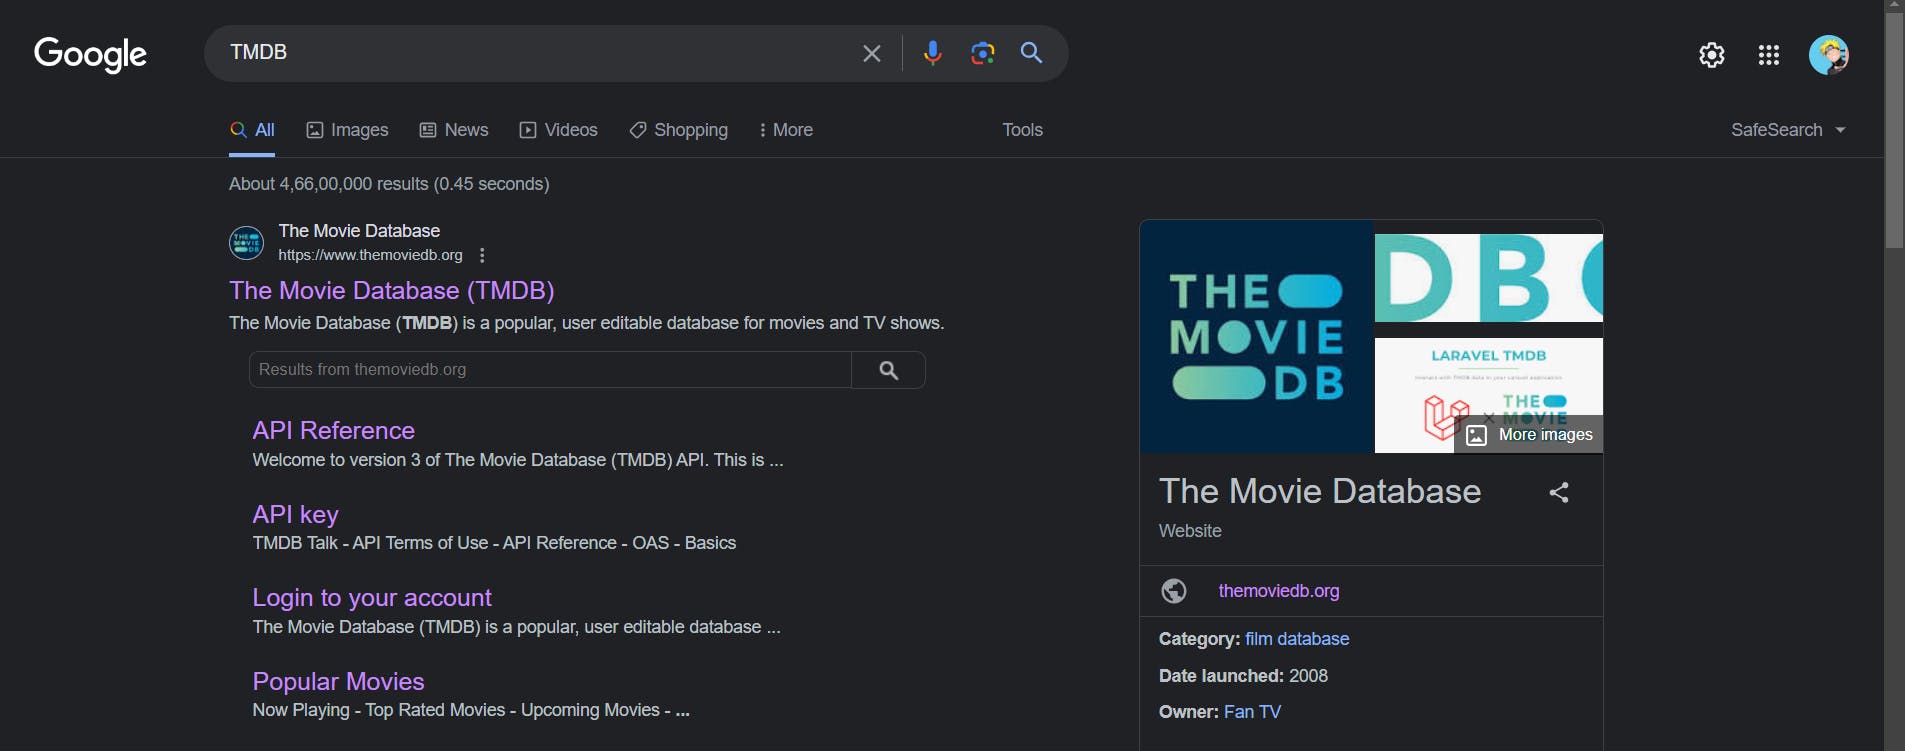
Click on the first result, you will see this page
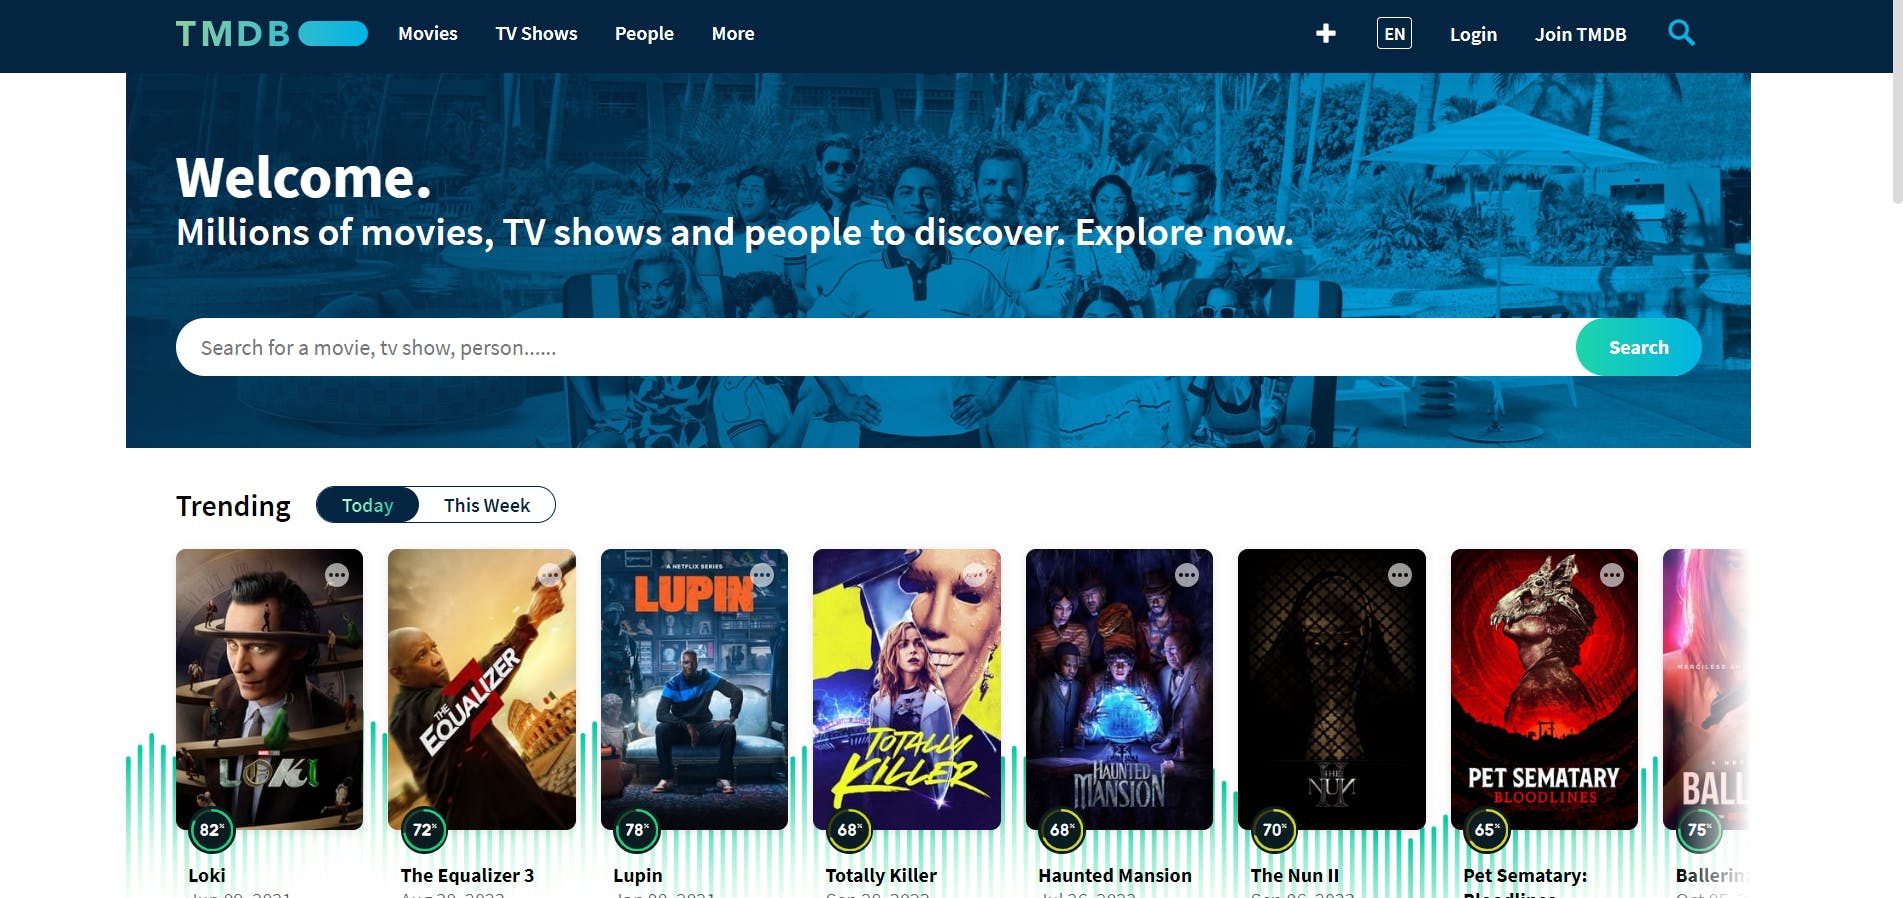
Click on the Login on the top right. You will get this page.
You need to create an account here. And you've to follow certain steps to create a TMDB API key.
Step 4: Install Prometheus and Grafana on the new Server
4A:- Install Prometheus
Let’s check the latest version of Prometheus from the download page.
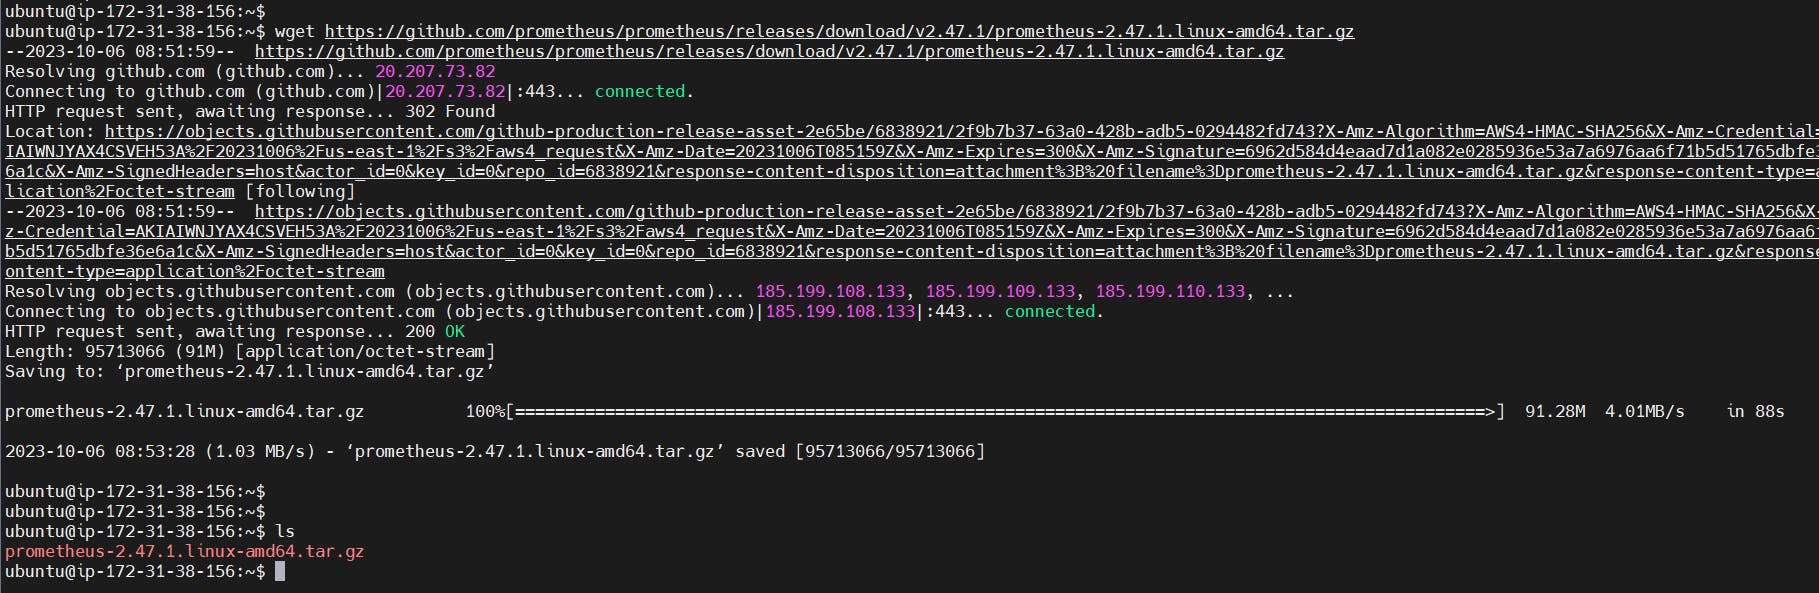
You can use the curl or wget command to download Prometheus.
wget https://github.com/prometheus/prometheus/releases/download/v2.47.1/prometheus-2.47.1.linux-amd64.tar.gz
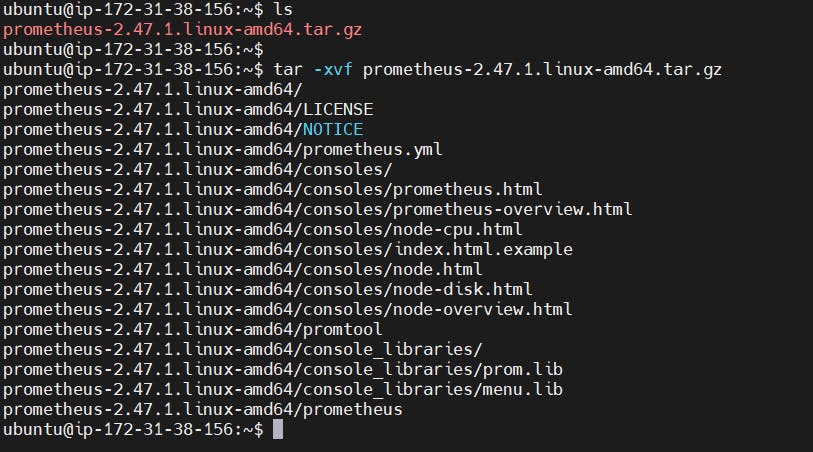
Then, we need to extract all Prometheus files from the archive:-
tar -xvf prometheus-2.47.1.linux-amd64.tar.gz
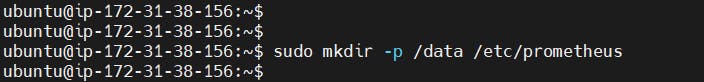
Usually, you would have a disk mounted to the data directory. For this tutorial, I will simply create a /data directory. Also, you need a folder for Prometheus configuration files.
sudo mkdir -p /data /etc/prometheus
Now, let’s change the directory to Prometheus and move some files:-
cd prometheus-2.47.1.linux-amd64/
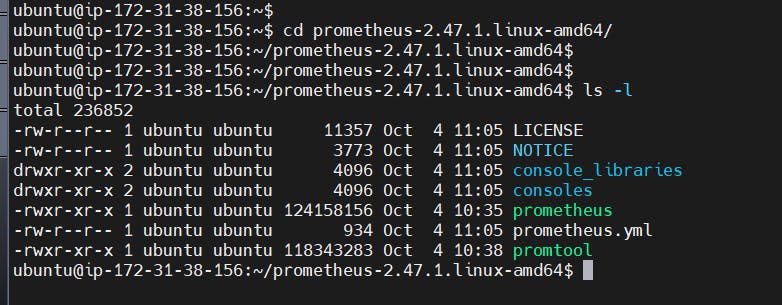
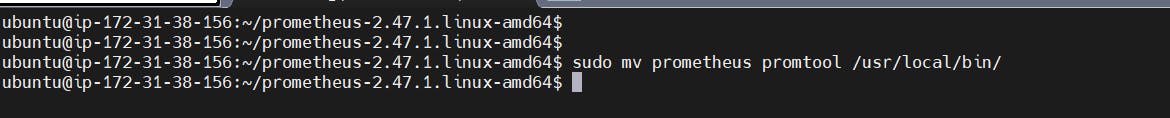
First of all, let’s move the Prometheus binary and a promtool to the /usr/local/bin/. promtool is used to check configuration files and Prometheus rules.
sudo mv prometheus promtool /usr/local/bin/
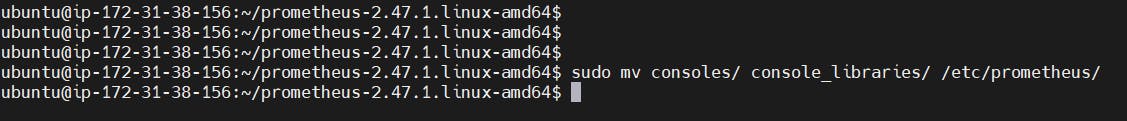
Optionally, we can move console libraries to the Prometheus configuration directory. Console templates allow for the creation of arbitrary consoles using the Go templating language. You don’t need to worry about it if you’re just getting started.
sudo mv consoles/ console_libraries/ /etc/prometheus/
Finally, let’s move the example of the main Prometheus configuration file.
sudo mv prometheus.yml /etc/prometheus/prometheus.yml

To avoid permission issues, you need to set the correct ownership for the /etc/prometheus/ and data directory.
sudo chown -R prometheus:prometheus /etc/prometheus/ /data/

Verify that you can execute the Prometheus binary by running the following command:
prometheus --version
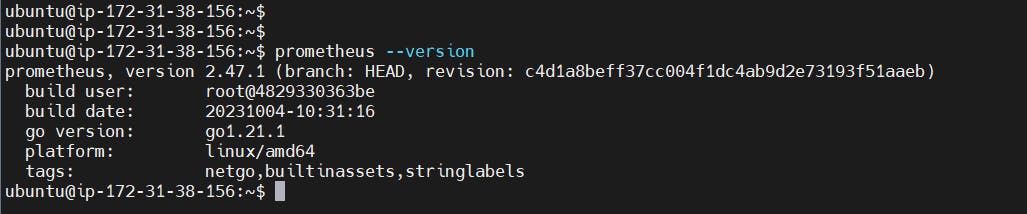
We’re going to use some of these options in the service definition.
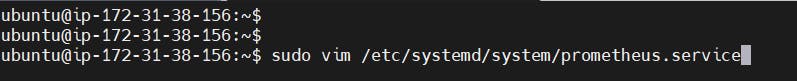
We’re going to use Systemd, which is a system and service manager for Linux operating systems. For that, we need to create a Systemd unit configuration file.
sudo vi /etc/systemd/system/prometheus.service
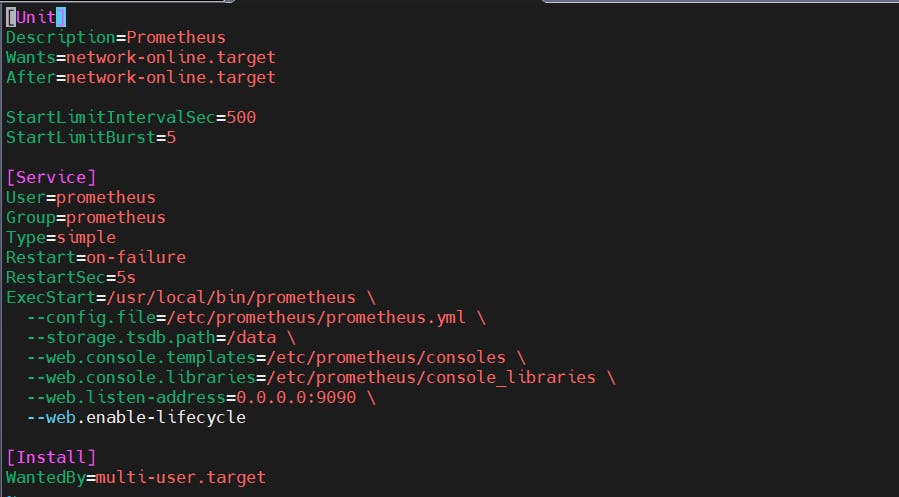
Prometheus.service
[Unit]
Description=Prometheus
Wants=network-online.target
After=network-online.target
StartLimitIntervalSec=500
StartLimitBurst=5

[Service]
User=prometheus
Group=prometheus
Type=simple
Restart=on-failure
RestartSec=5s
ExecStart=/usr/local/bin/prometheus \
  --config.file=/etc/prometheus/prometheus.yml \
  --storage.tsdb.path=/data \
  --web.console.templates=/etc/prometheus/consoles \
  --web.console.libraries=/etc/prometheus/console_libraries \
  --web.listen-address=0.0.0.0:9090 \
  --web.enable-lifecycle

[Install]
WantedBy=multi-user.target
To automatically start the Prometheus after reboot, run enable:-
sudo systemctl enable prometheus

Then just start the Prometheus:-
sudo systemctl start prometheus
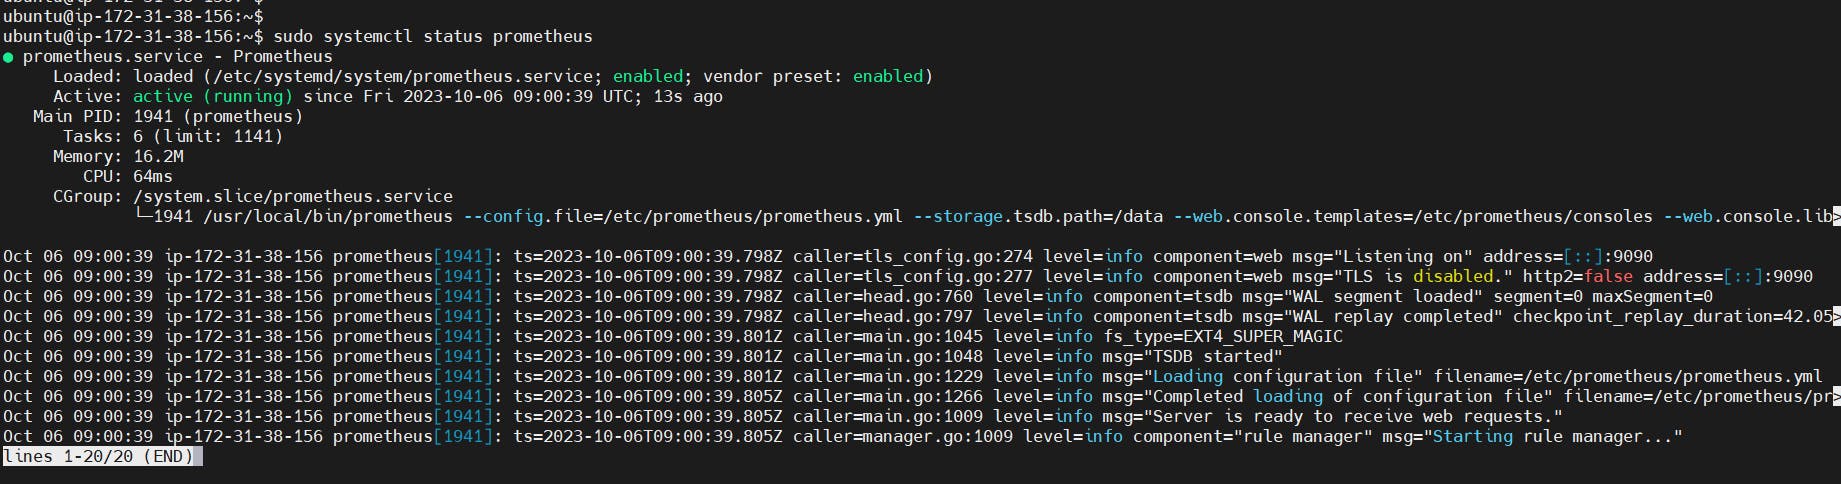
To check the status of Prometheus run the following command:-
sudo systemctl status prometheus
Suppose you encounter any issues with Prometheus or are unable to start it. The easiest way to find the problem is to use the journalctl command and search for errors:-
journalctl -u prometheus -f --no-pager
Now we can try to access it via the browser. I’m going to be using the IP address of the Ubuntu server. You need to open up on port 9090 to the public IP address.
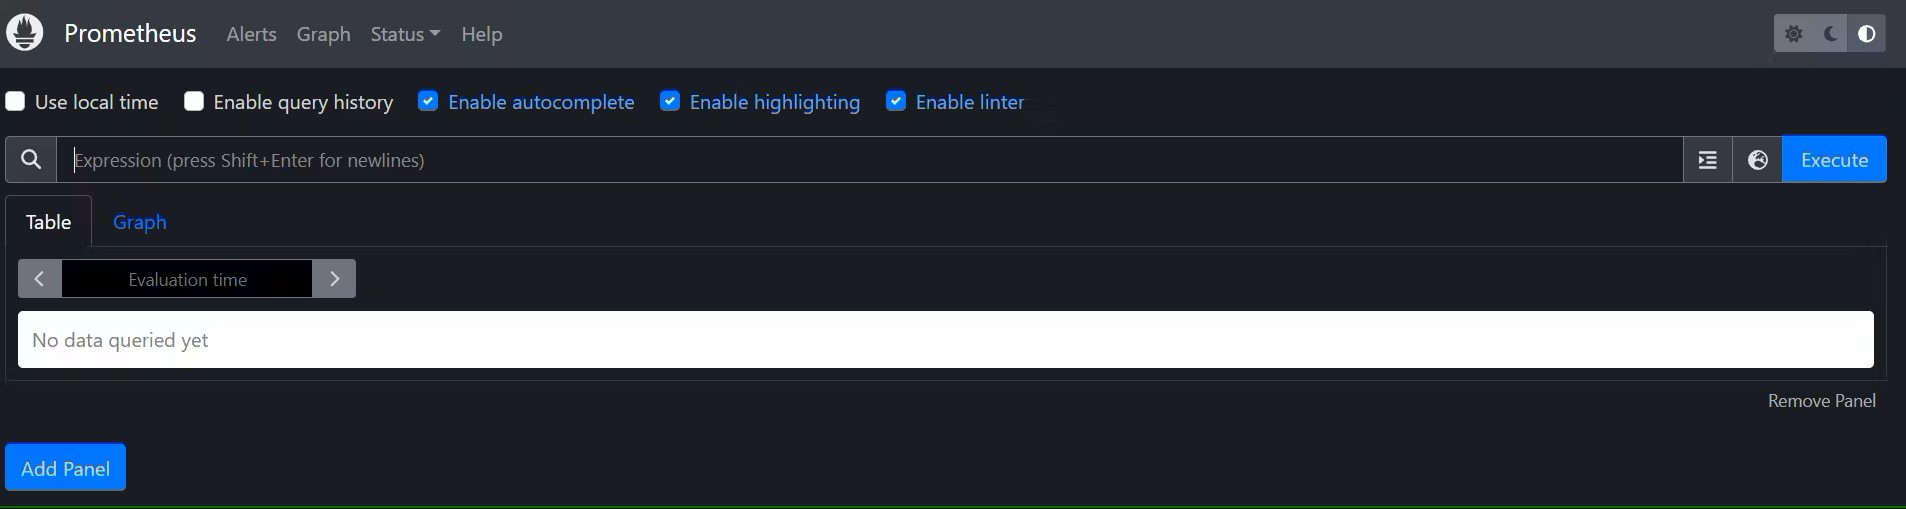
If you go to targets, you should see only one – Prometheus target. It scrapes itself every 15 seconds by default.
4B:- Install Node Exporter on Ubuntu 22.04
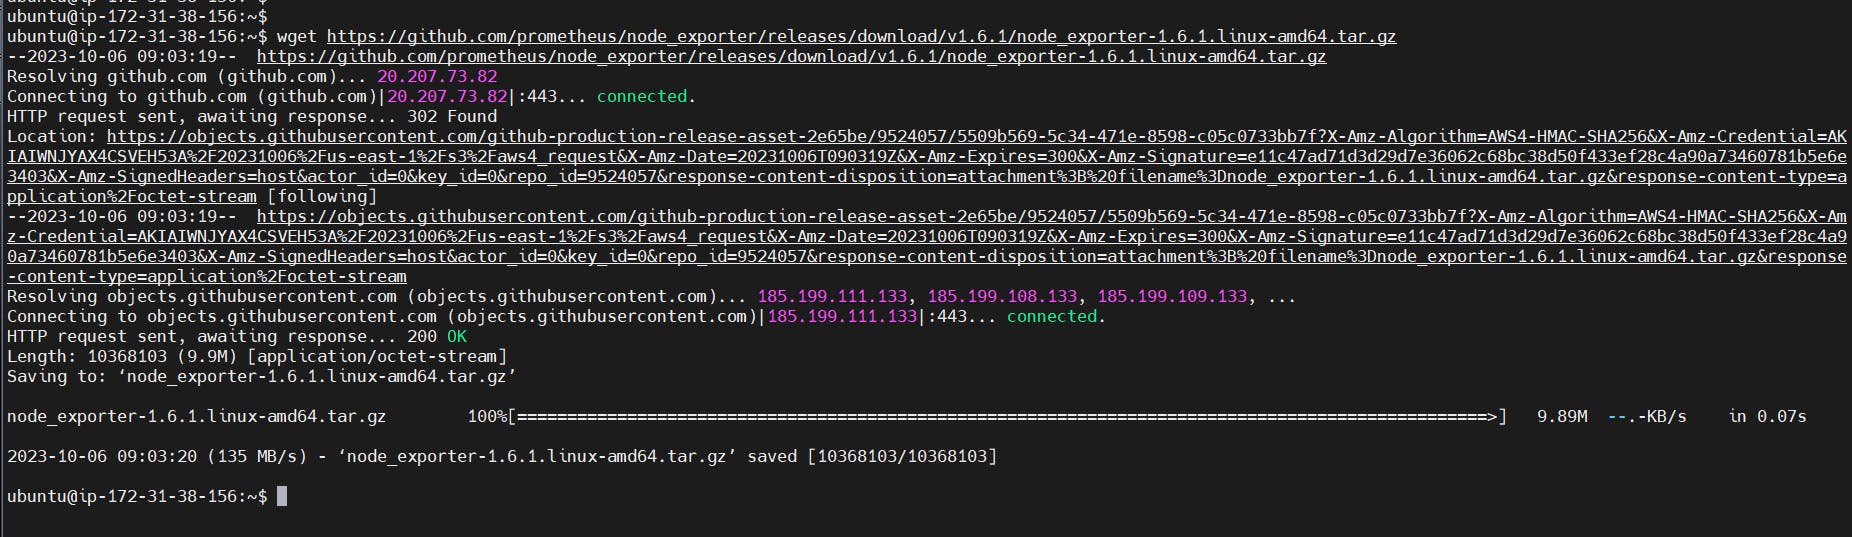
Use the wget command to download the binary.
wget https://github.com/prometheus/node_exporter/releases/download/v1.6.1/node_exporter-1.6.1.linux-amd64.tar.gz
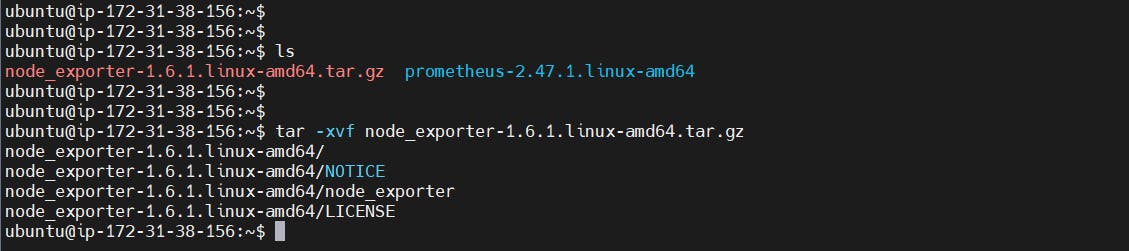
Extract the node exporter from the archive:-
tar -xvf node_exporter-1.6.1.linux-amd64.tar.gz
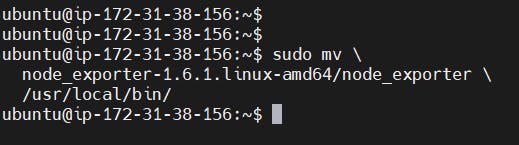
Move binary to the /usr/local/bin.
sudo mv \
  node_exporter-1.6.1.linux-amd64/node_exporter \
  /usr/local/bin/
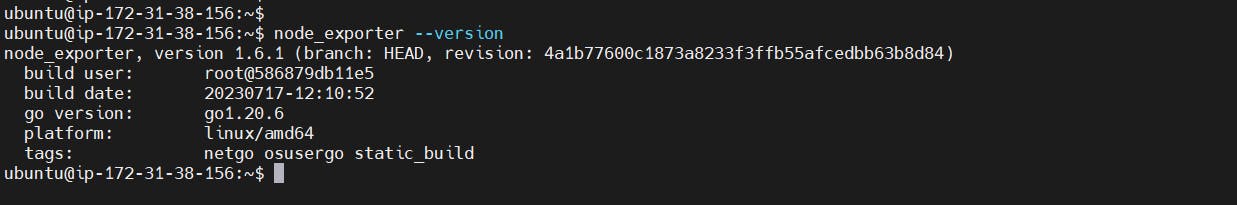
Verify that you can run the binary i.e. Node Exporter:-
node_exporter --version
Node Exporter has a lot of plugins that we can enable. If you run Node Exporter help you will get all the options:-
node_exporter --help
collector.logind We’re going to enable the login controller, just for the demo.
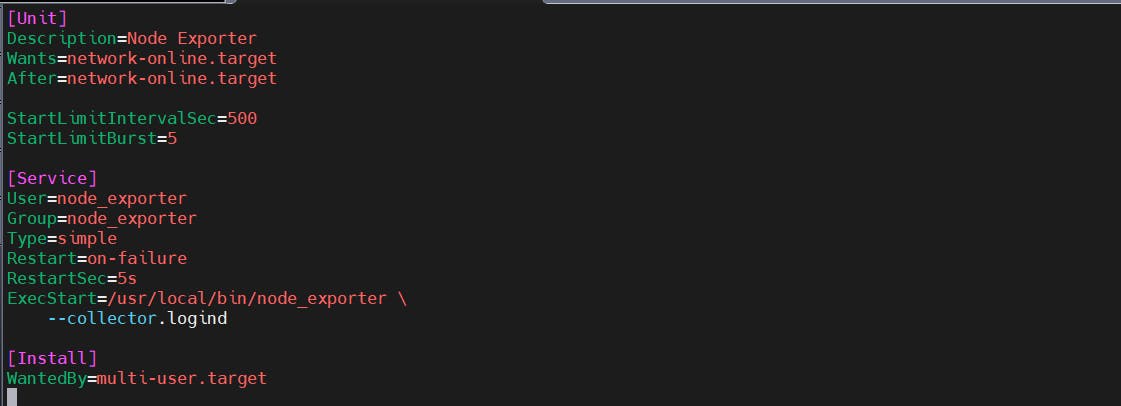
Next, create a similar systemd unit file:-
sudo vim /etc/systemd/system/node_exporter.service

node_exporter.service
[Unit]
Description=Node Exporter
Wants=network-online.target
After=network-online.target
StartLimitIntervalSec=500
StartLimitBurst=5

[Service]
User=node_exporter
Group=node_exporter
Type=simple
Restart=on-failure
RestartSec=5s
ExecStart=/usr/local/bin/node_exporter \
    --collector.logind

[Install]
WantedBy=multi-user.target
Replace Prometheus user and group to node_exporter, and update the ExecStart command.
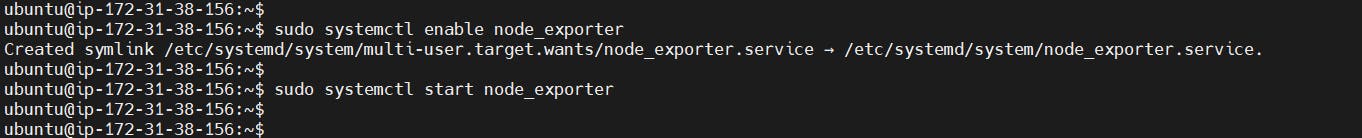
To automatically start the Node Exporter after reboot, enable the service:-
sudo systemctl enable node_exporter
Then start the Node Exporter:-
sudo systemctl start node_exporter
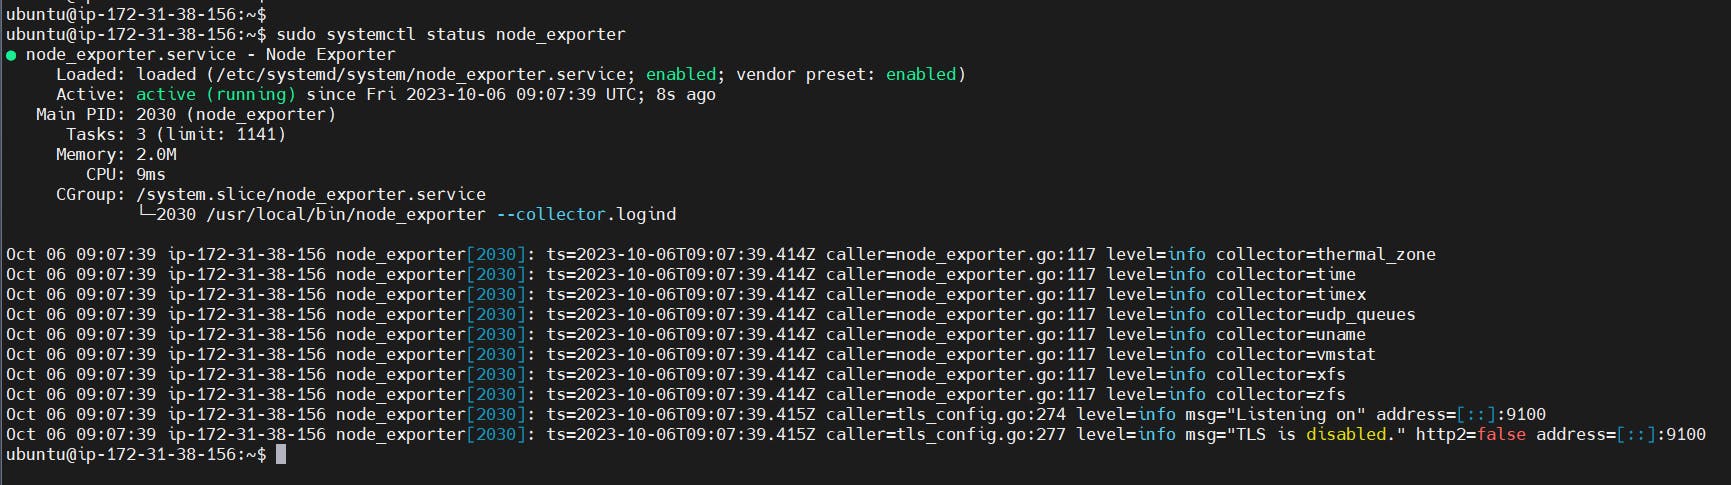
Check the status of Node Exporter with the following command:-
sudo systemctl status node_exporter
If you have any issues, check logs with journalctl:-
journalctl -u node_exporter -f --no-pager
At this point, we have only a single target in our Prometheus. There are many different service discovery mechanisms built into Prometheus. For example, Prometheus can dynamically discover targets in AWS, GCP, and other clouds based on the labels. In the following tutorials, I’ll give you a few examples of deploying Prometheus in a cloud-specific environment. For this tutorial, let’s keep it simple and keep adding static targets. Also, I have a lesson on how to deploy and manage Prometheus in the Kubernetes cluster.
To create a static target, you need to add job_name with static_configs:-
sudo vi /etc/prometheus/prometheus.yml
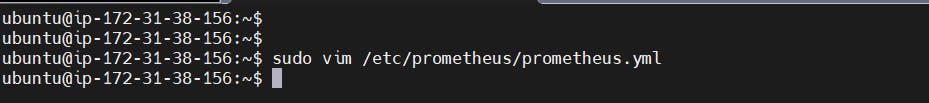
prometheus.yml
- job_name: node_export
    static_configs:
      - targets: ["localhost:9100"]
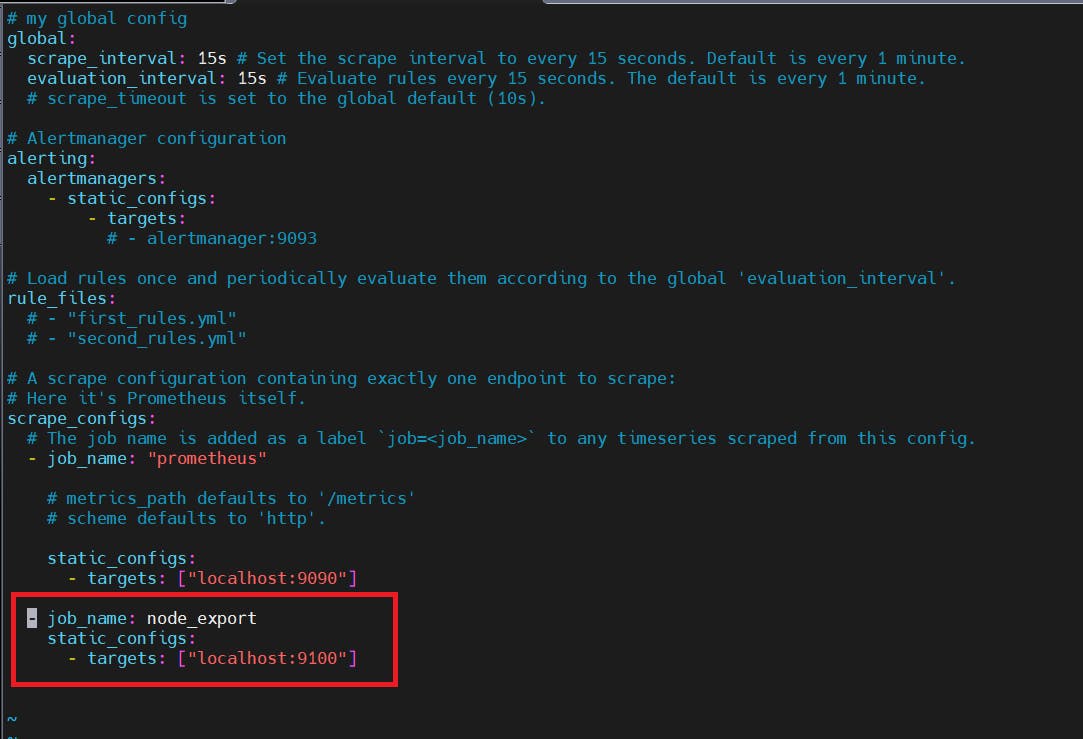
By default, Node Exporter will be exposed on port 9100.
Since we enabled lifecycle management via API calls, we can reload the Prometheus config without restarting the service and causing downtime.
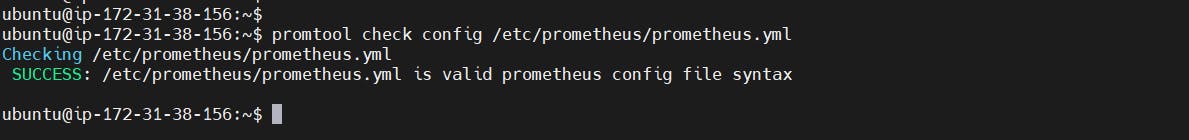
Before, restarting check if the config is valid.
promtool check config /etc/prometheus/prometheus.yml
Then, you can use a POST request to reload the config:-
curl -X POST http://localhost:9090/-/reload
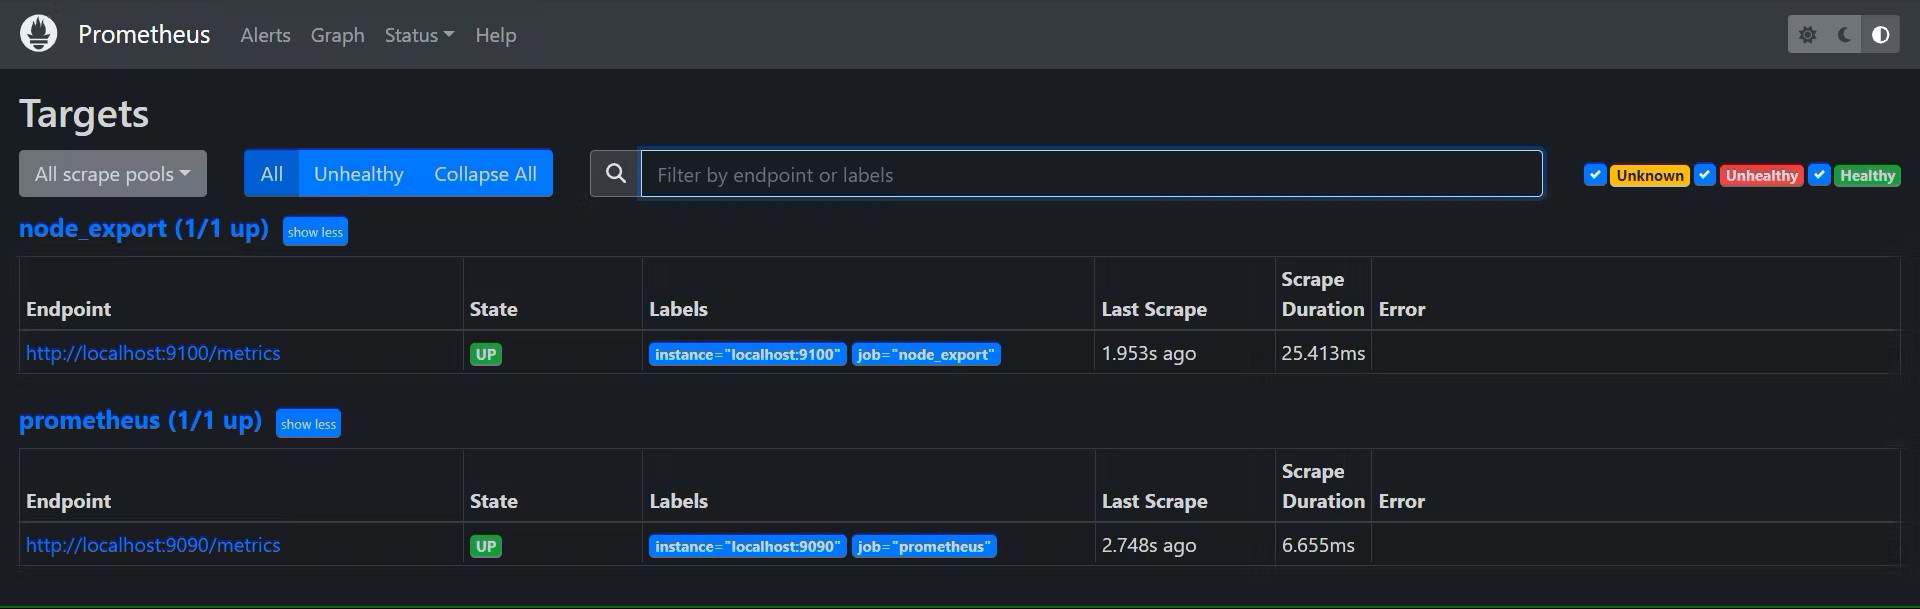
Check the targets section
http://<public_ip>:9090/targets
4C:- Install Grafana on Ubuntu 22.04
To visualize metrics we can use Grafana. There are many different data sources that Grafana supports, one of them is Prometheus.
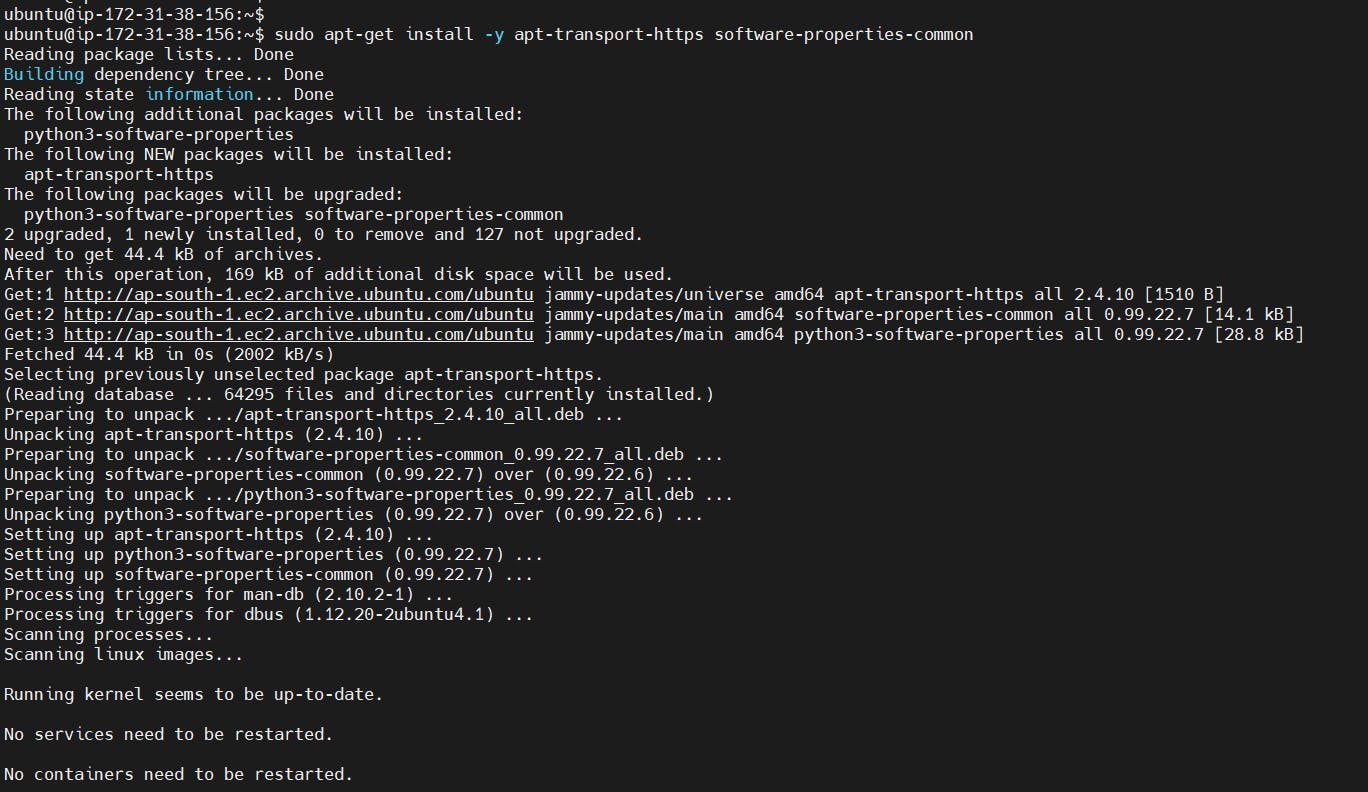
First, let’s make sure that all the dependencies are installed.
sudo apt-get install -y apt-transport-https software-properties-common
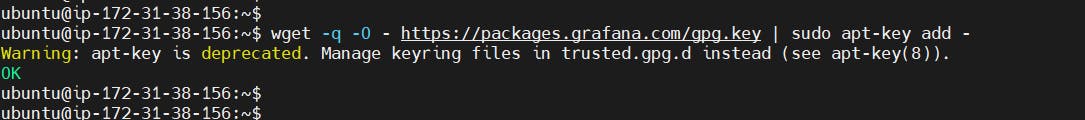
Next, add the GPG key:-
wget -q -O - https://packages.grafana.com/gpg.key | sudo apt-key add -
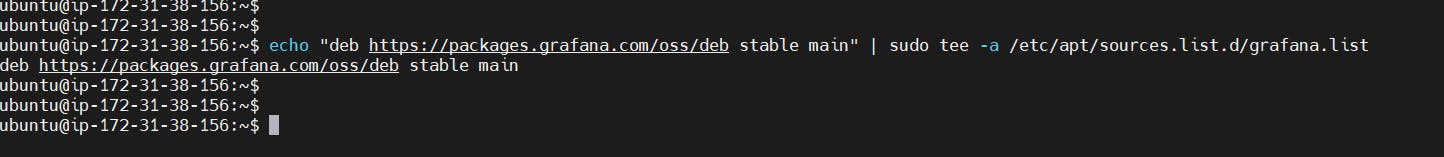
Add this repository for stable releases:-
echo "deb https://packages.grafana.com/oss/deb stable main" | sudo tee -a /etc/apt/sources.list.d/grafana.list
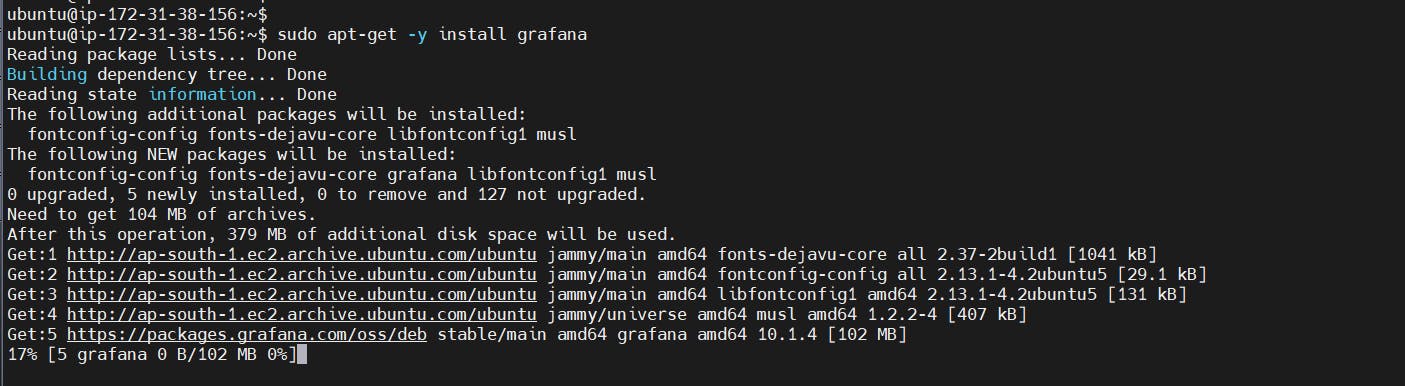
After you add the repository, update and install Garafana:-
sudo apt-get update
sudo apt-get -y install grafana
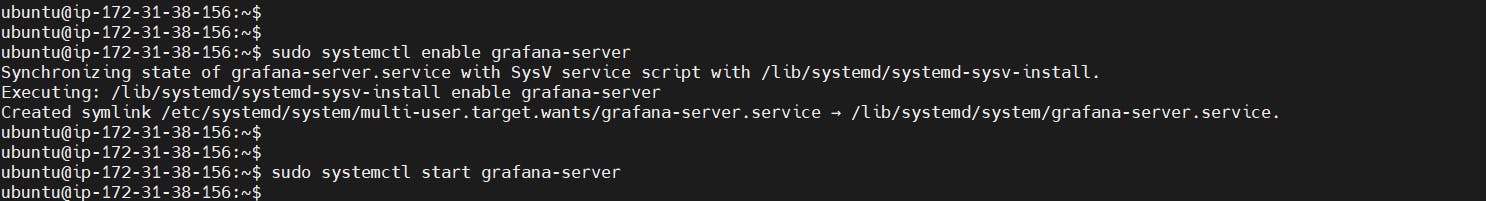
To automatically start the Grafana after reboot, enable the service:-
sudo systemctl enable grafana-server
sudo systemctl start grafana-server
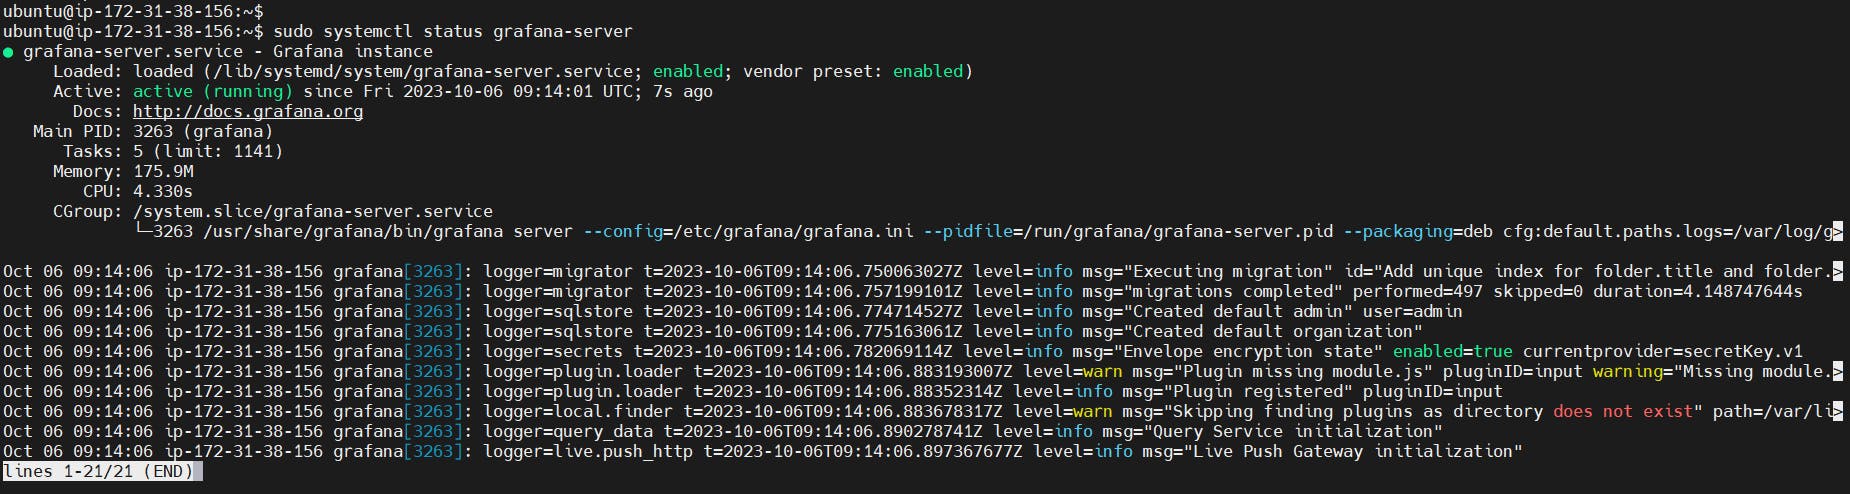
To check the status of Grafana, run the following command:-
sudo systemctl status grafana-server
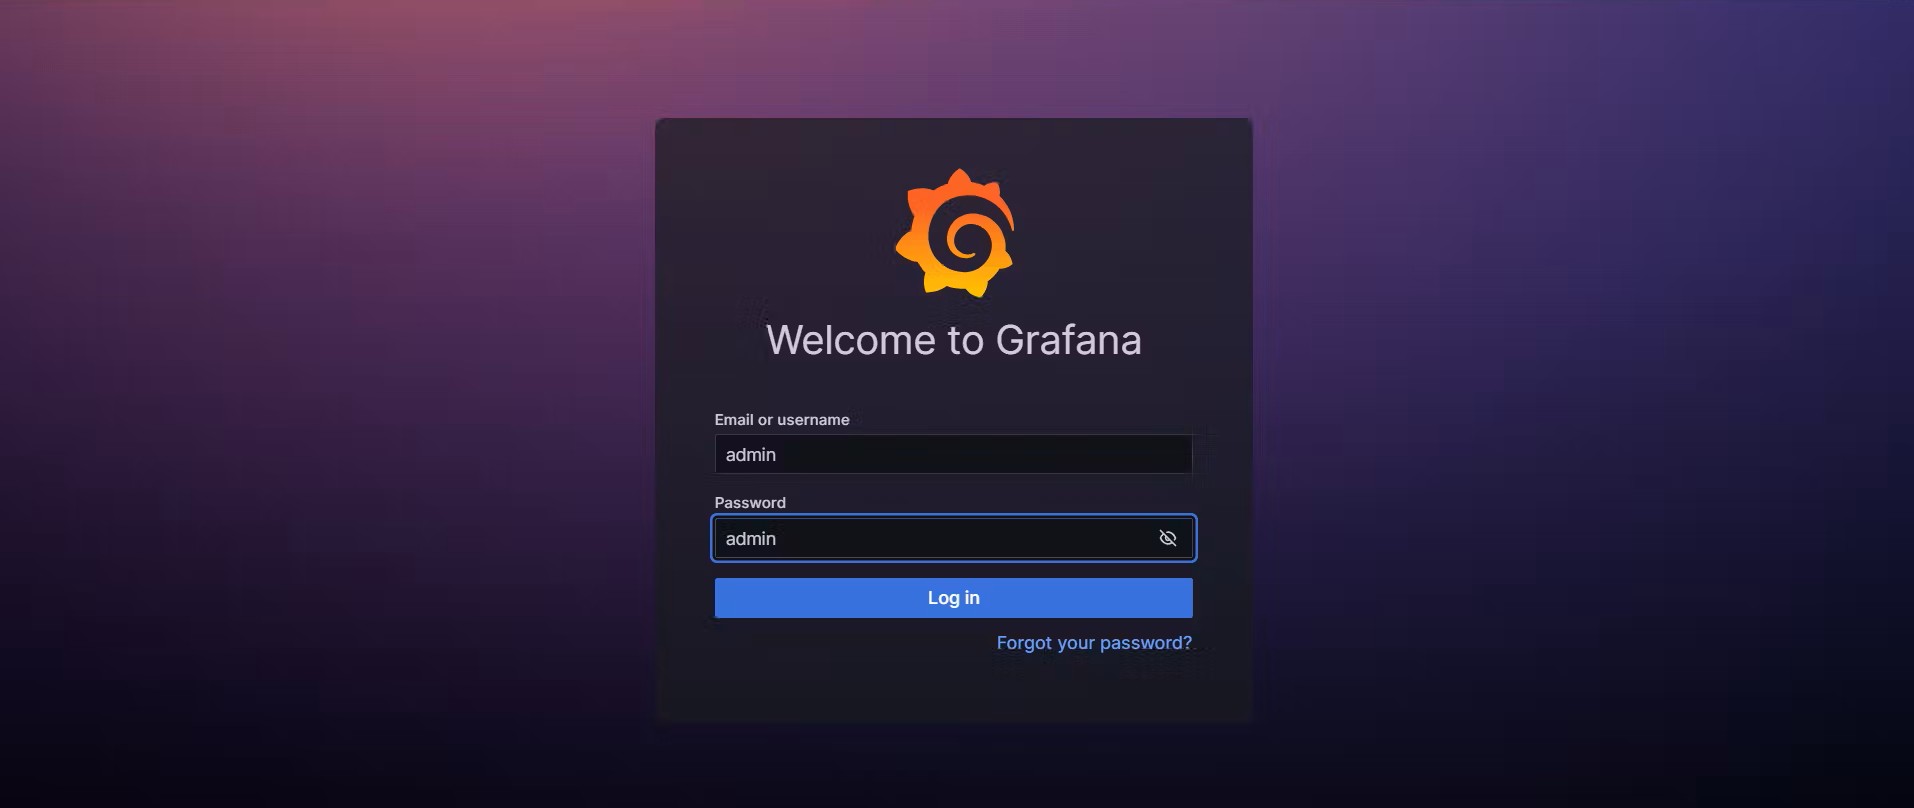
Go to http://<public_ip>:3000 and log in to the Grafana using default credentials. The username is admin, and the password is admin as well.
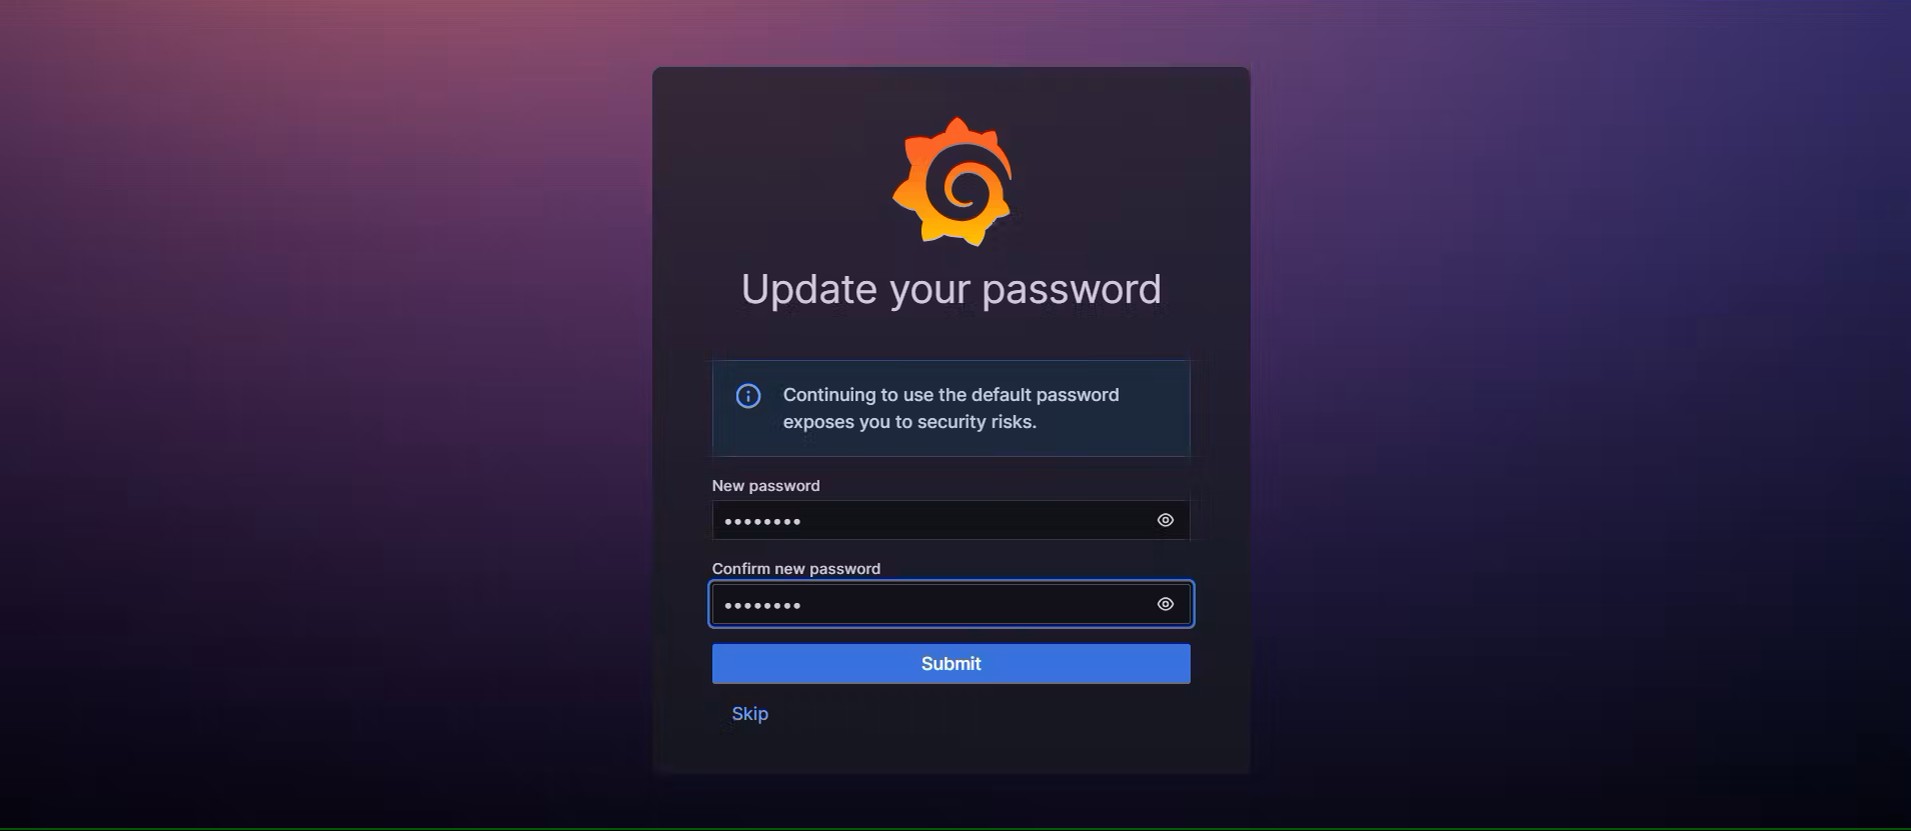
When you log in for the first time, you get the option to change the password.
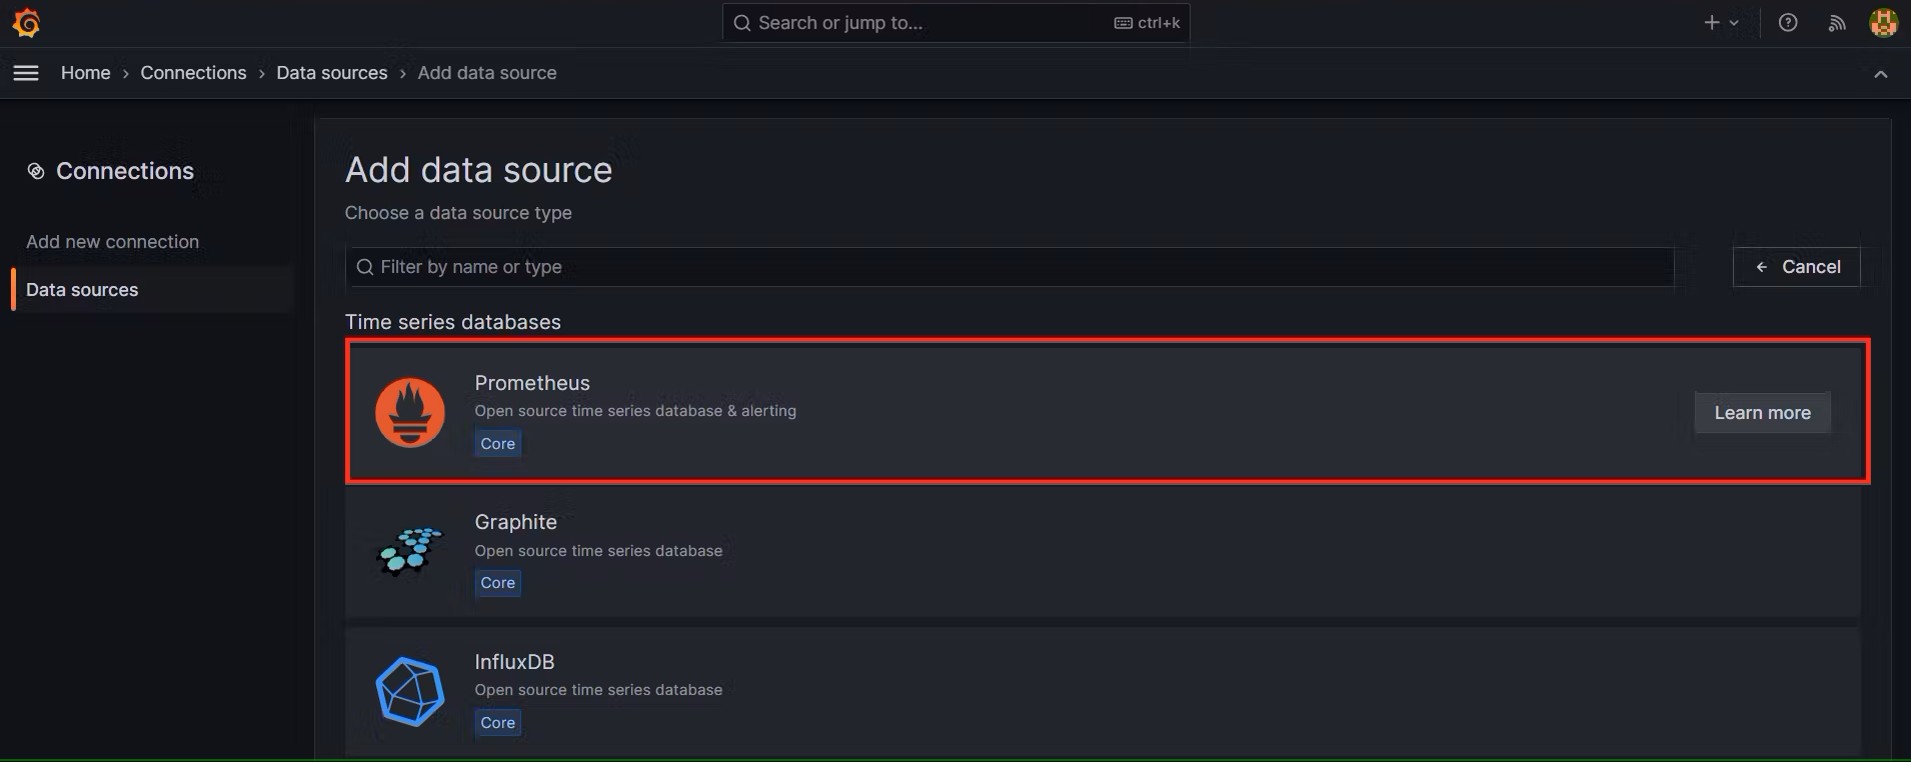
To visualize metrics, you need to add a data source first:-
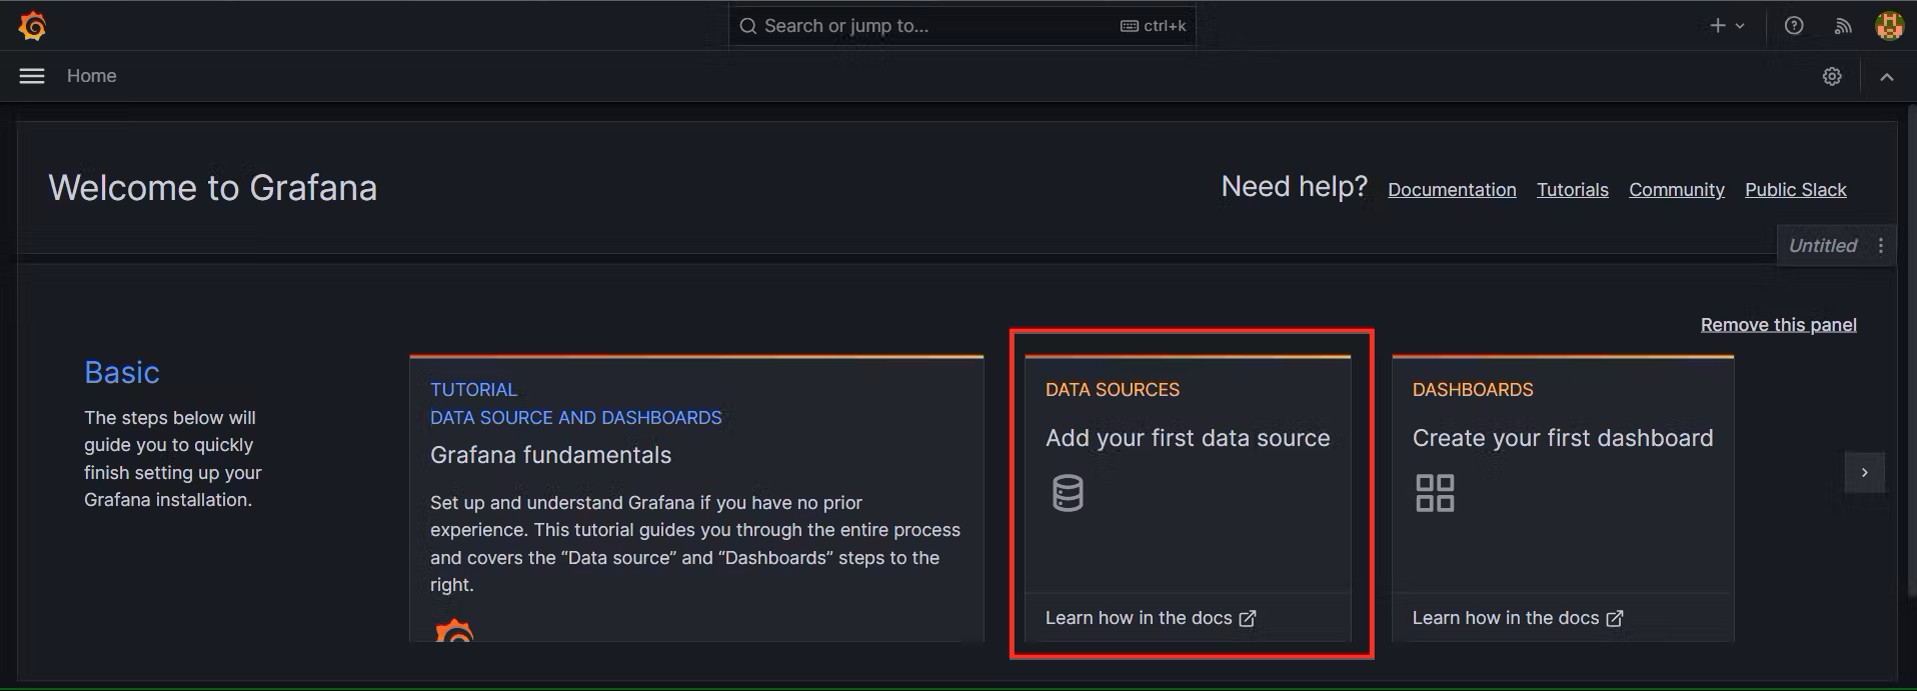
Click Add data source and select Prometheus:-
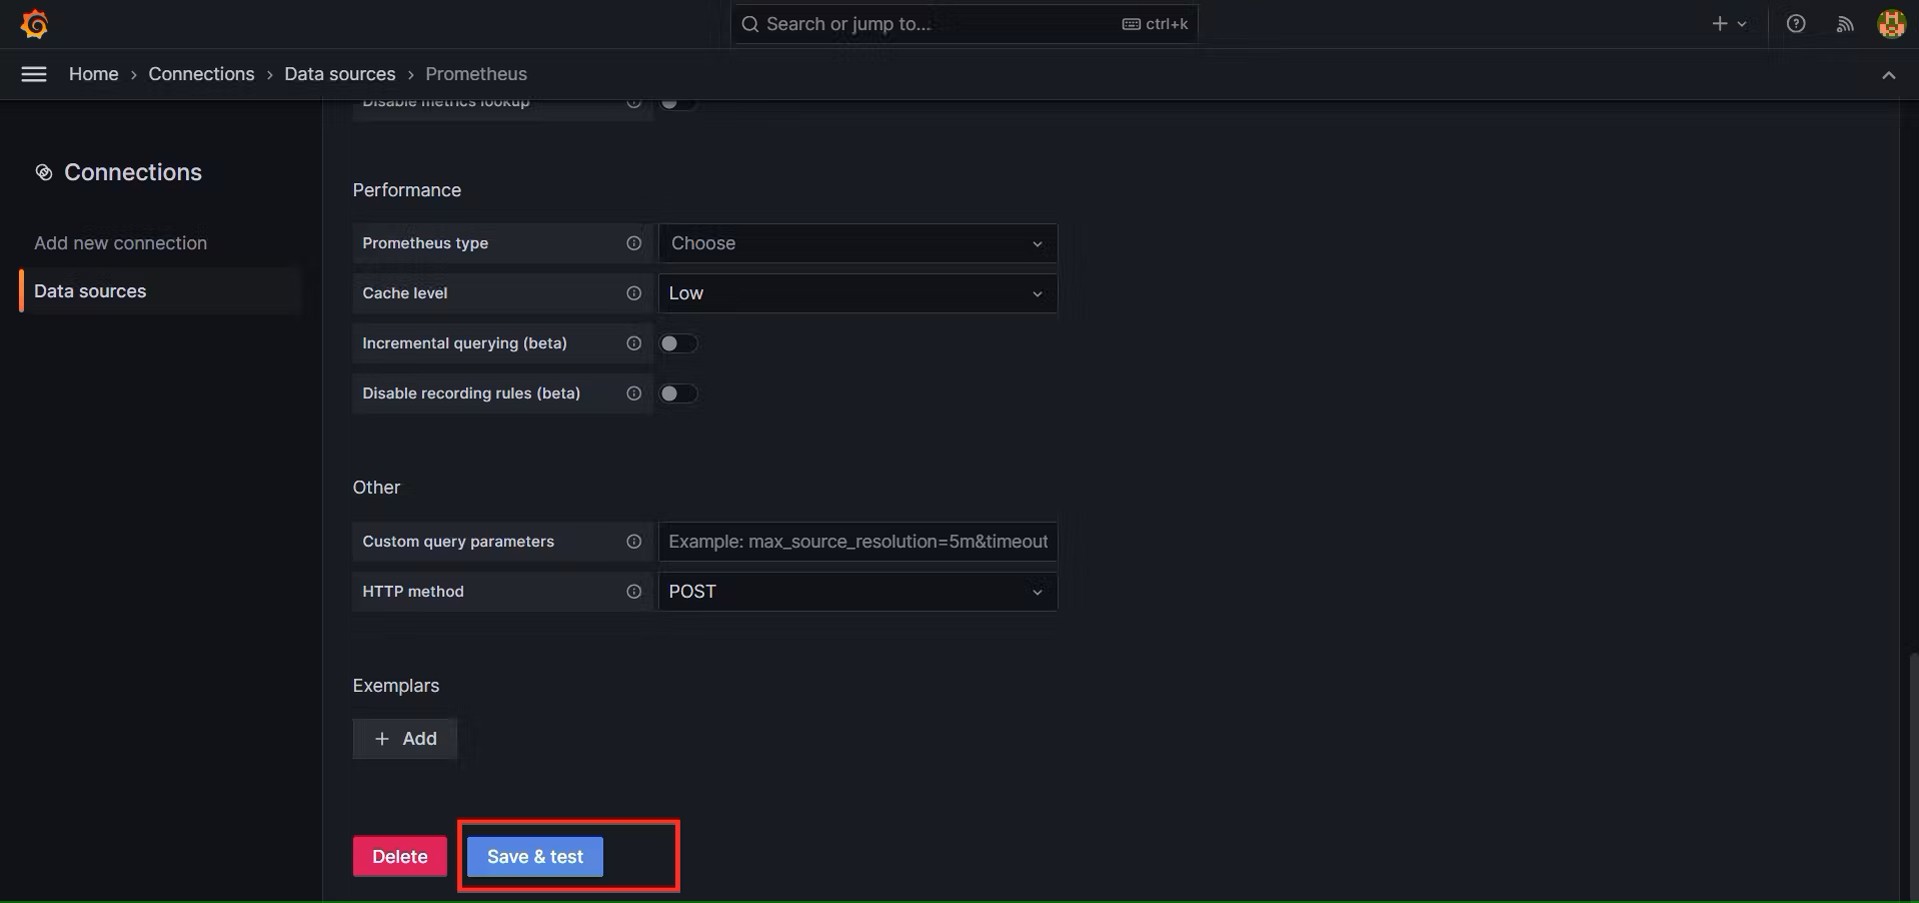
For the URL, enter localhost:9090 and click Save and test. You can see Data source is working or not:-
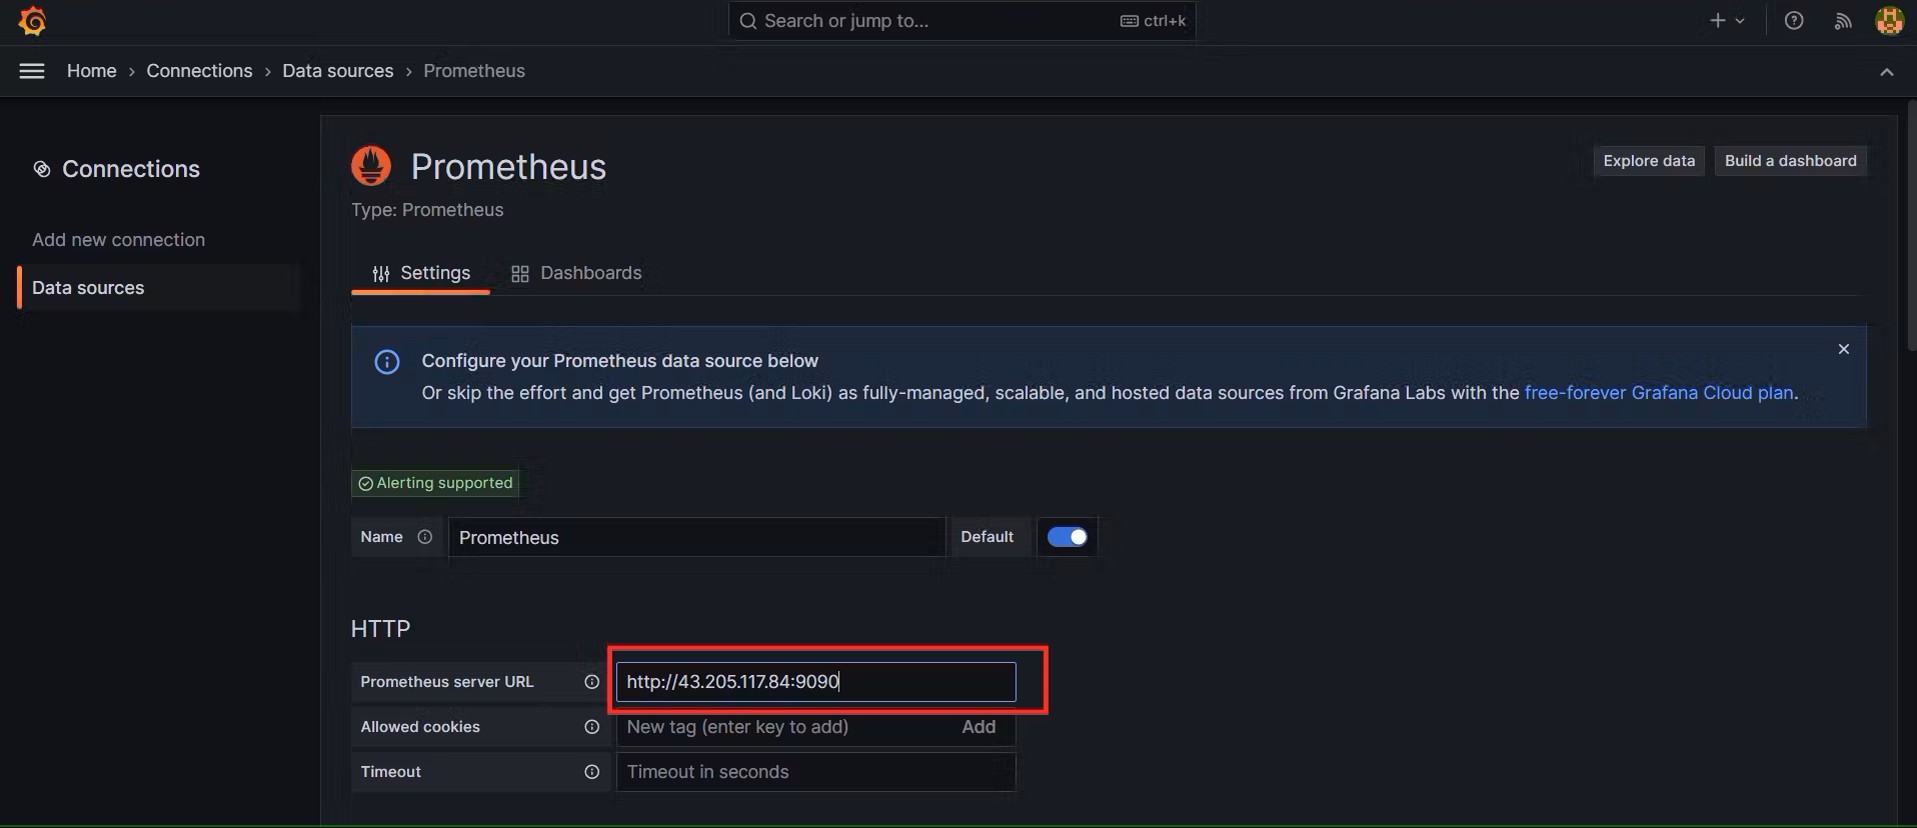
Click on Save and Test:-
Let’s add Dashboard for a better view:-
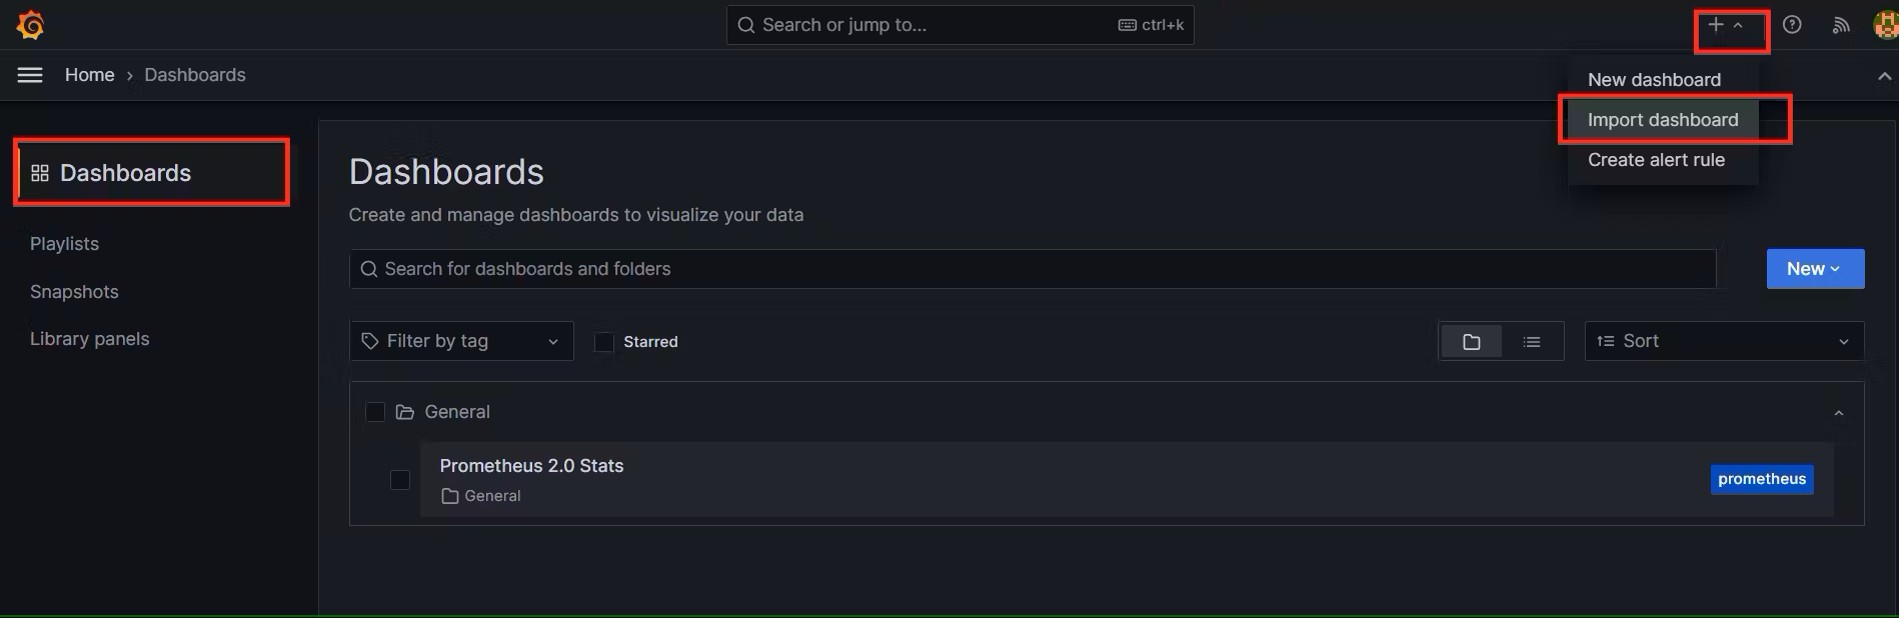
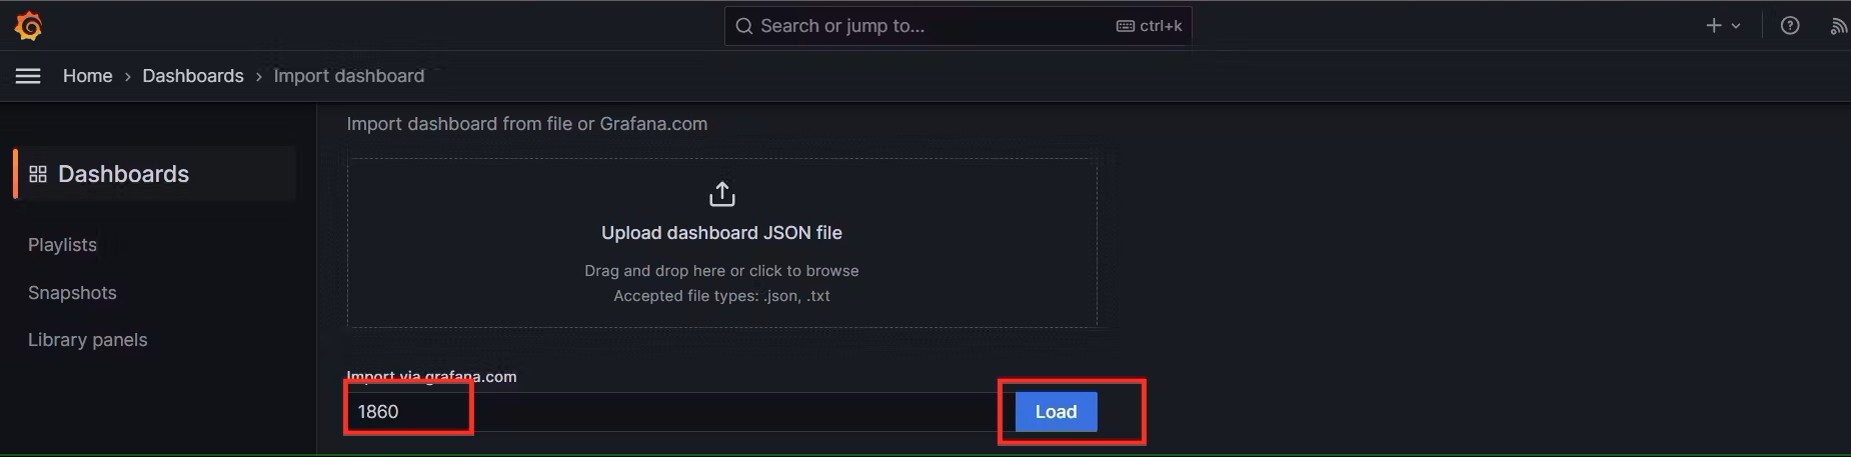
Click on Import Dashboard paste this code 1860 and click on load:-
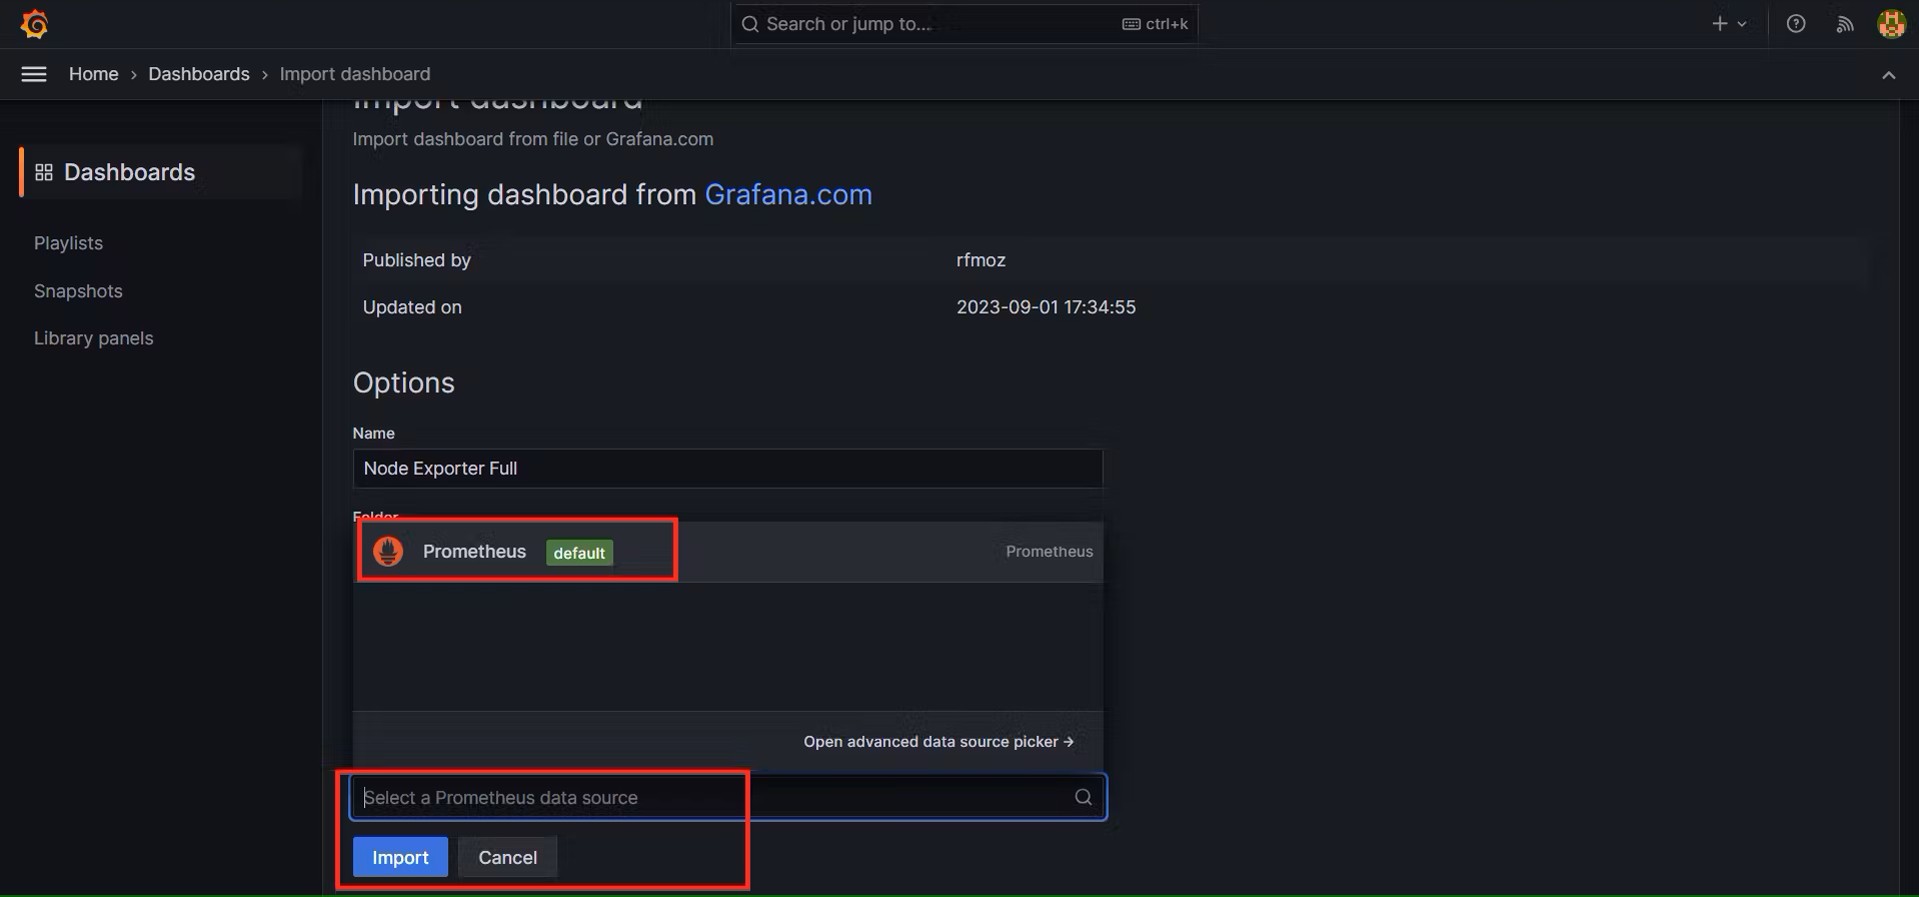
Select the Data Source and click on Import:-
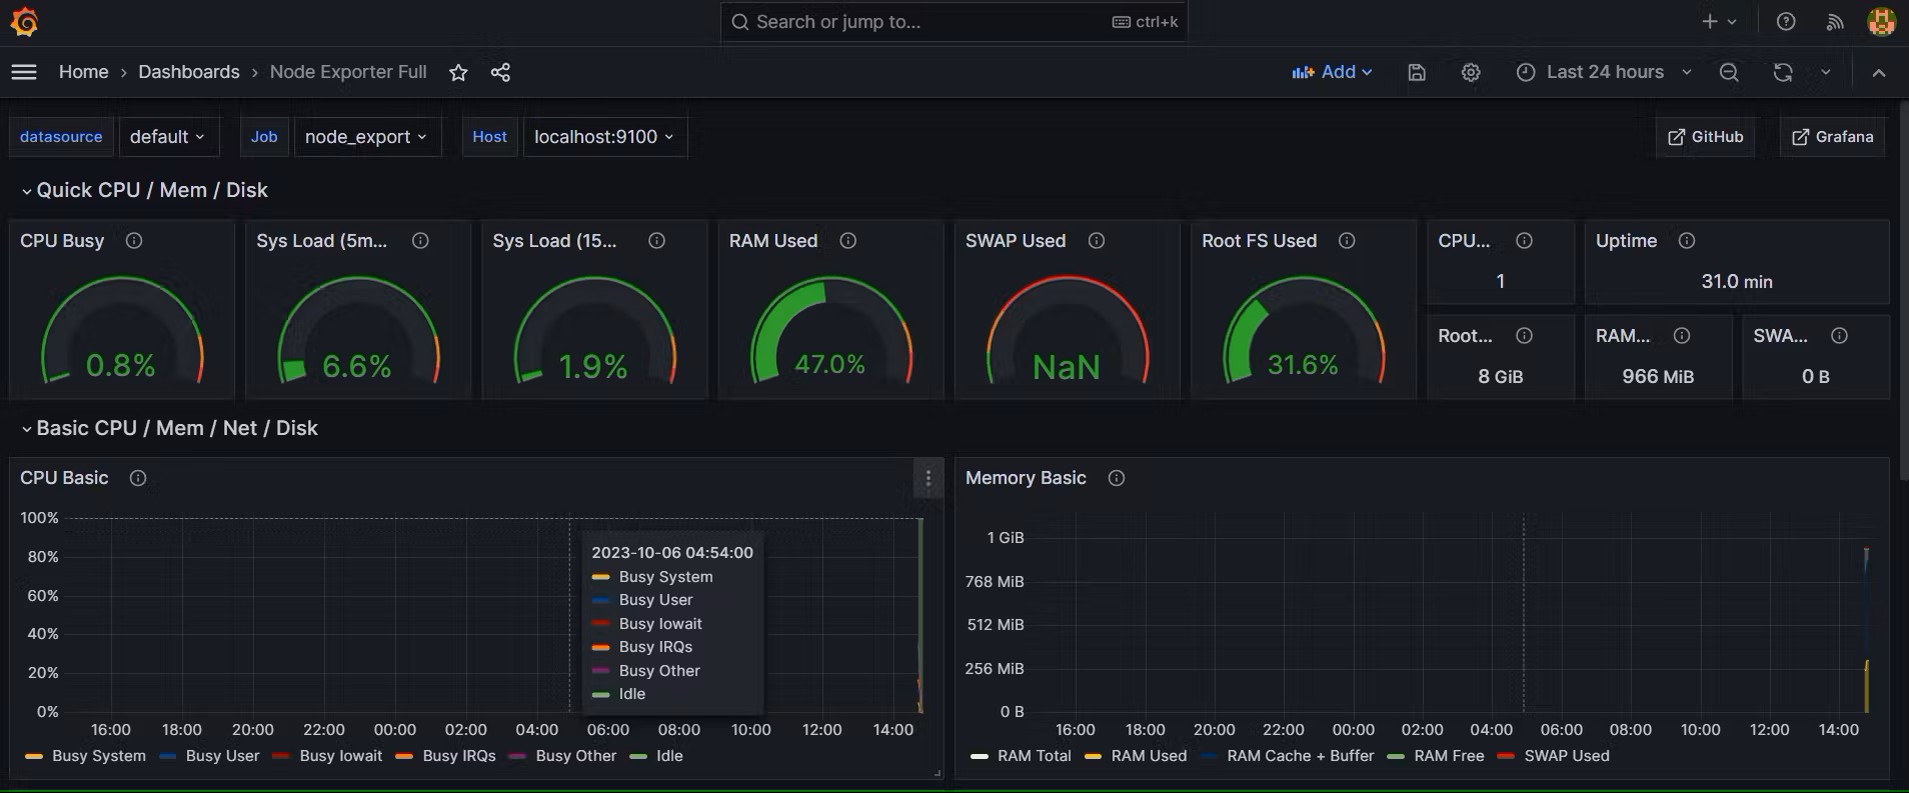
You will see this output like this:-
Step 5:- Install the Prometheus Plugin and Integrate it with the Prometheus server
Let’s Monitor JENKINS SYSTEM NOW
Goto Manage Jenkins –> Plugins –> Available Plugins
Search for Prometheus and install it
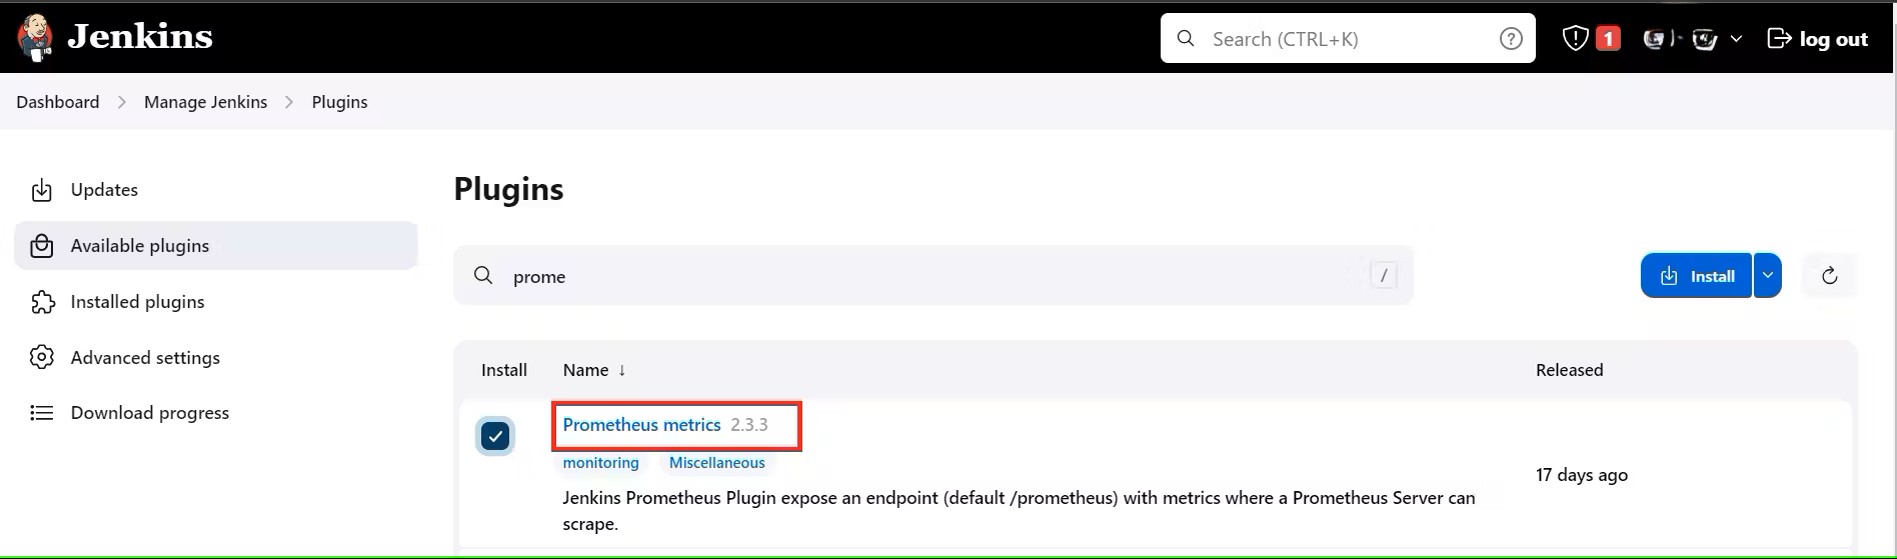
Once that is done you will Prometheus is set to /Prometheus path in system configurations:-
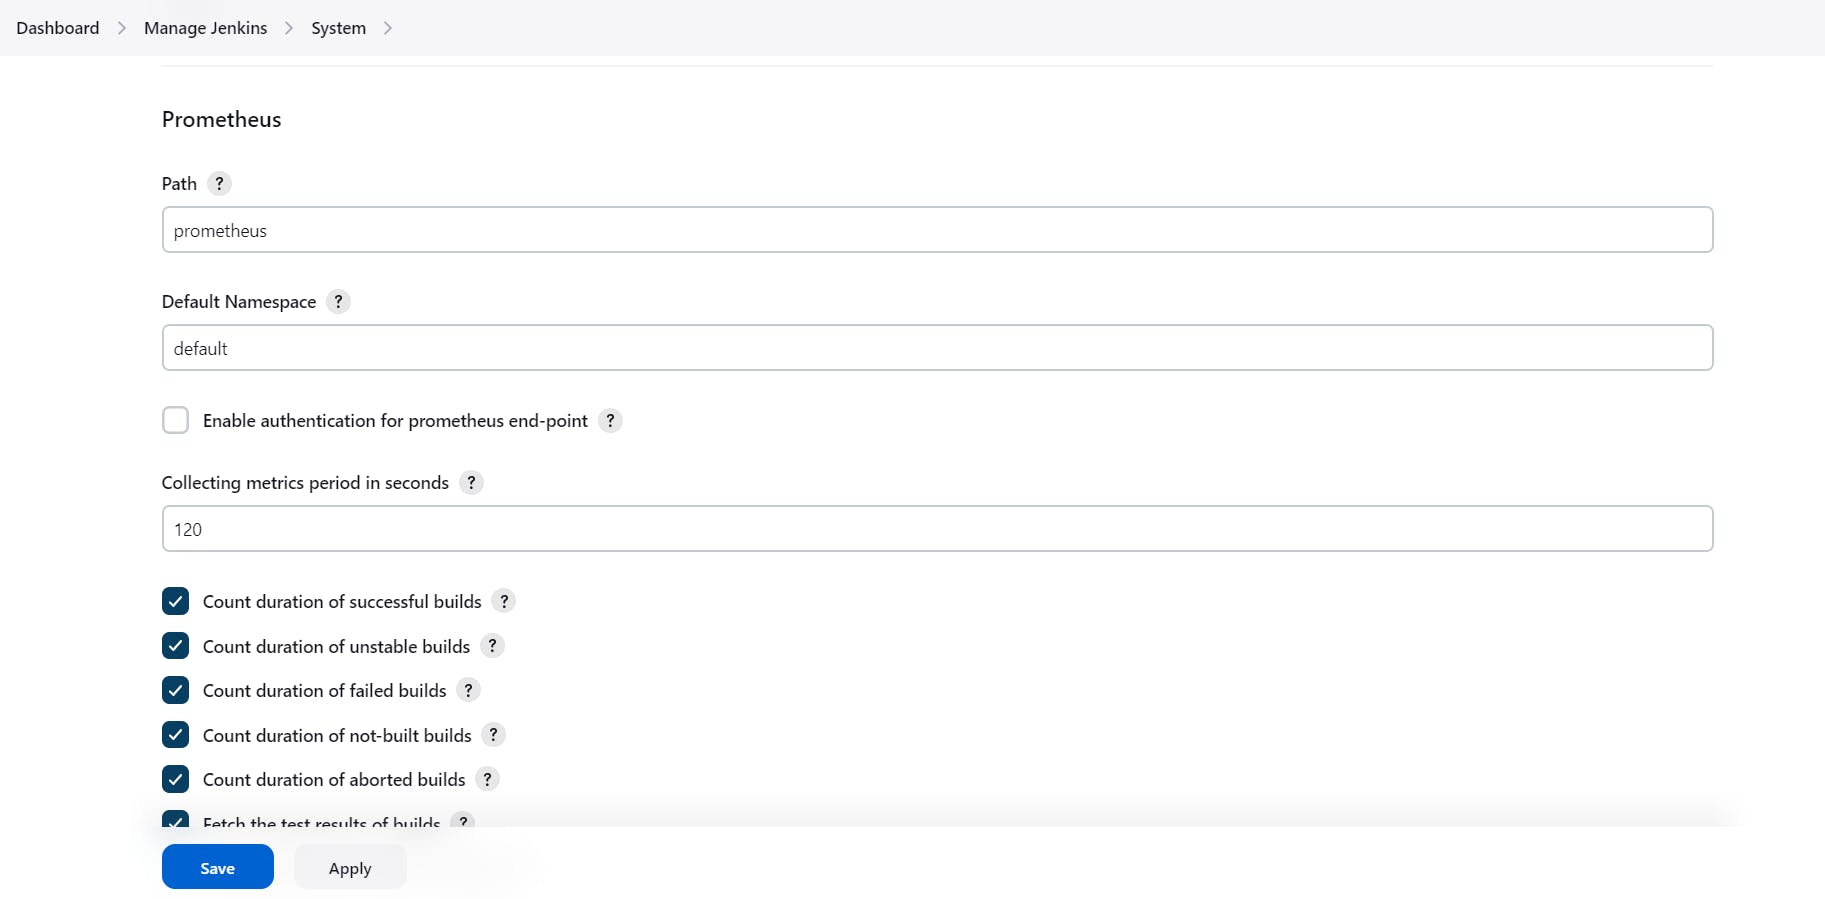
Nothing to change click on apply and save
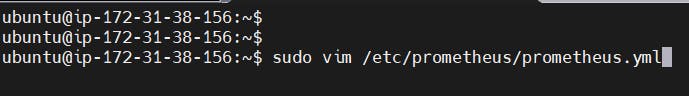
To create a static target, you need to add job_name with static_configs, go to Prometheus server:-
sudo vim /etc/prometheus/prometheus.yml
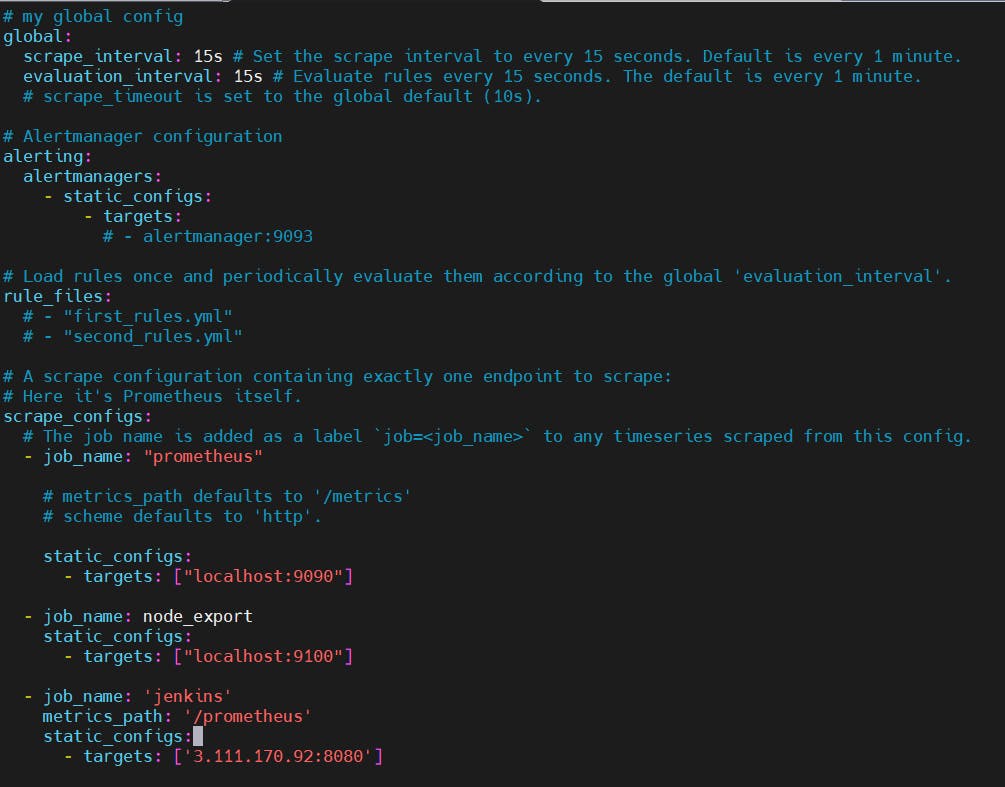
Paste below code:-
- job_name: 'jenkins'
    metrics_path: '/prometheus'
    static_configs:
      - targets: ['<jenkins-ip>:8080']
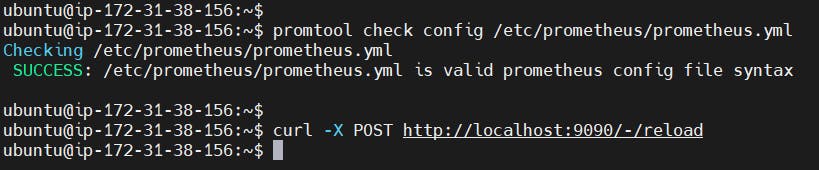
Before, restarting check if the config is valid or not:-
promtool check config /etc/prometheus/prometheus.yml
Then, you can use a POST request to reload the config:-
curl -X POST http://localhost:9090/-/reload
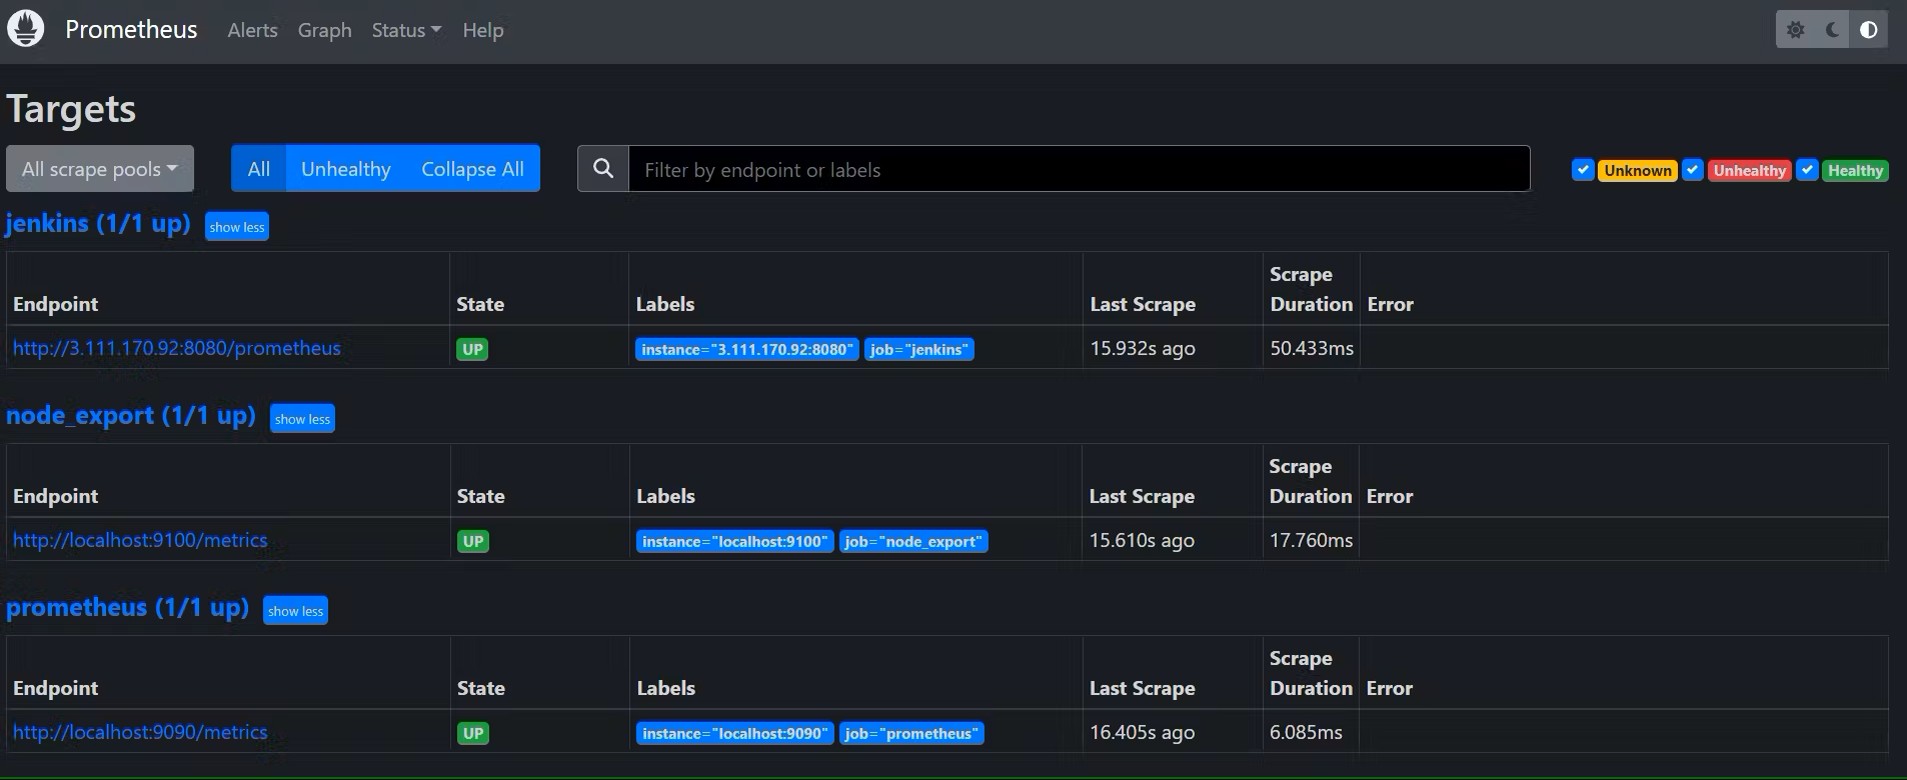
Now again check the targets section:-
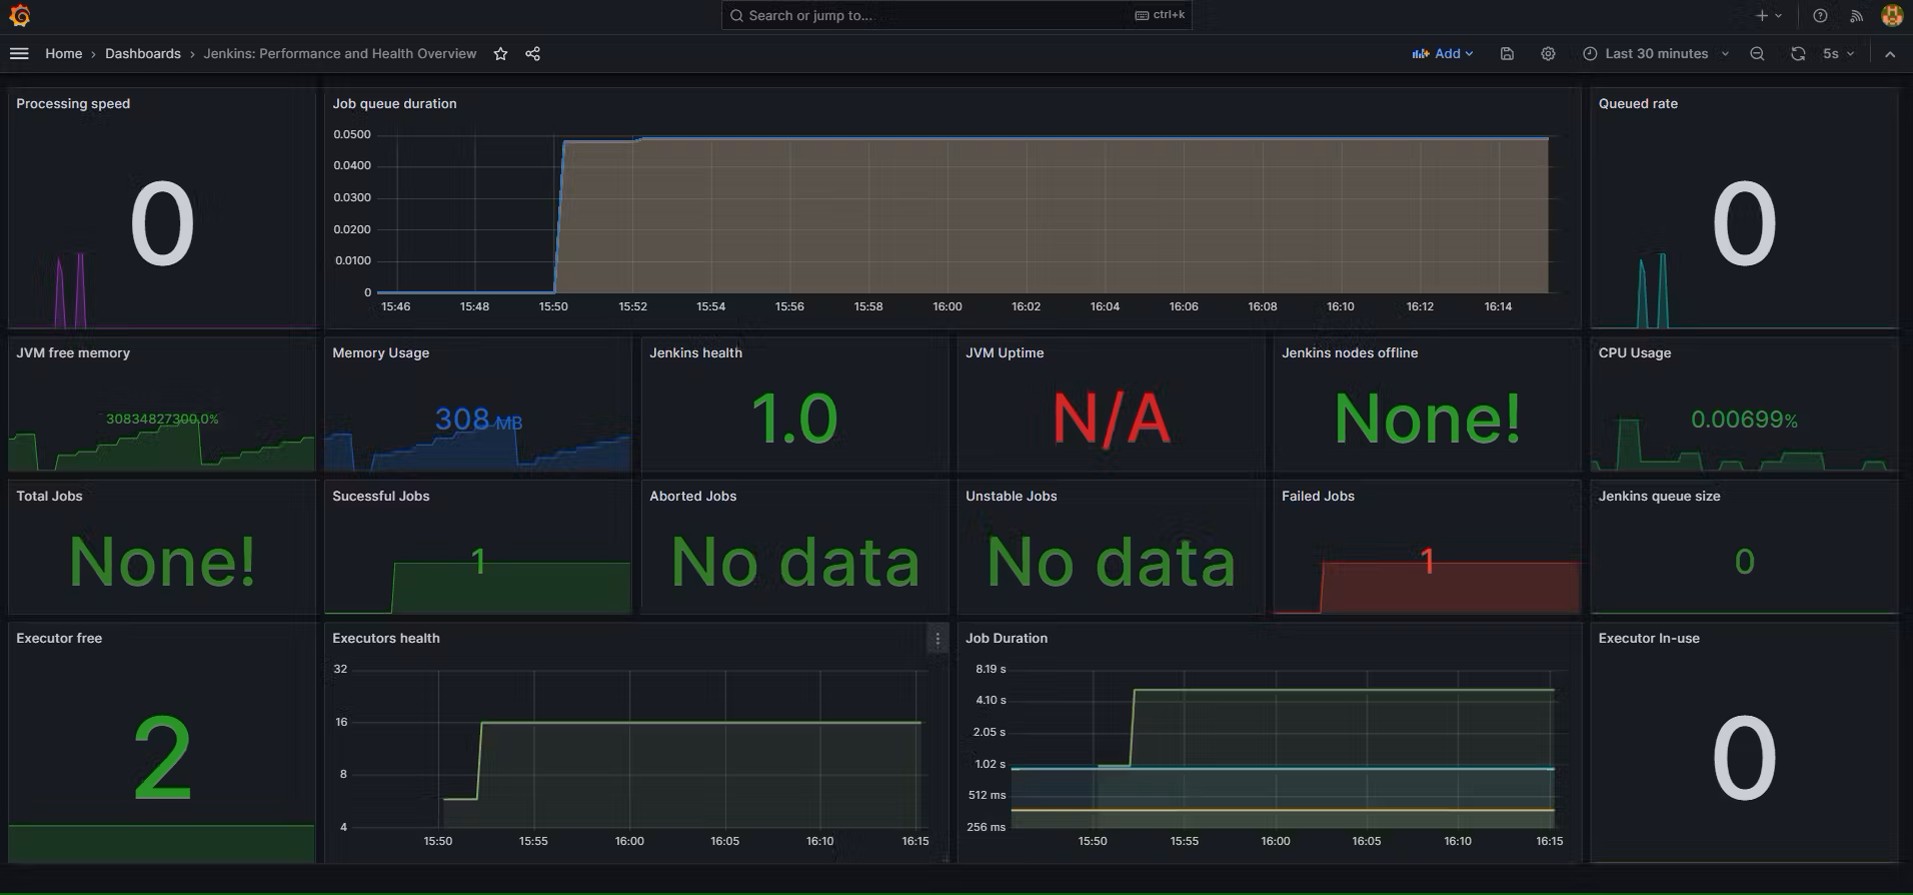
Let’s add Dashboard for a better view in Grafana
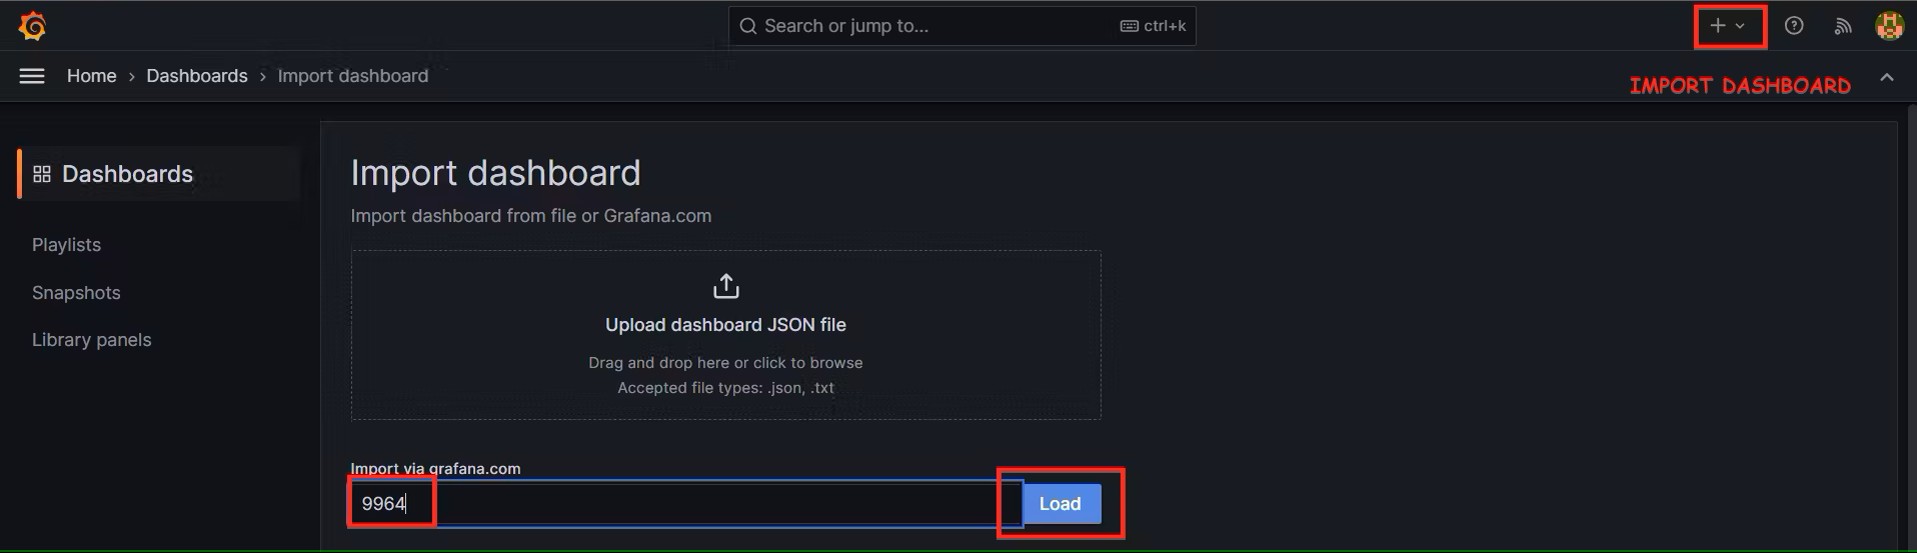
Click On Dashboard –> + symbol –> Import Dashboard
Use Id 9964 and click on load
Select the data source and click on Import:-
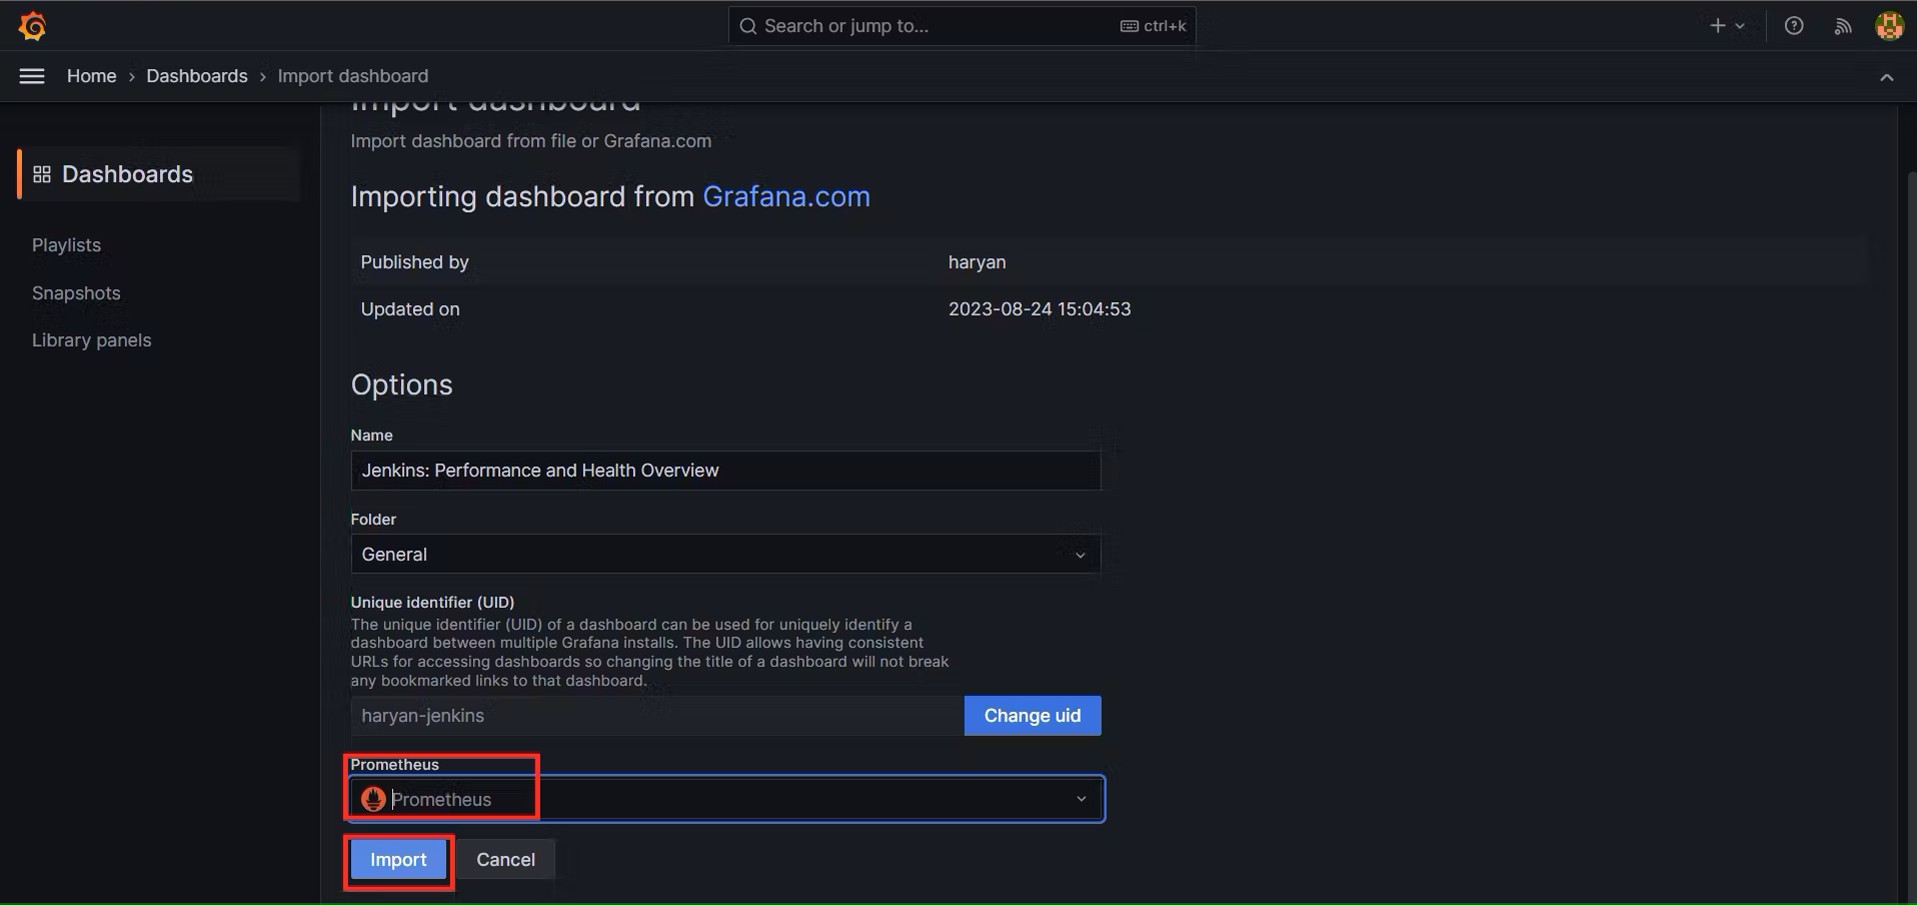
Now you will see the Detailed overview of Jenkins:-
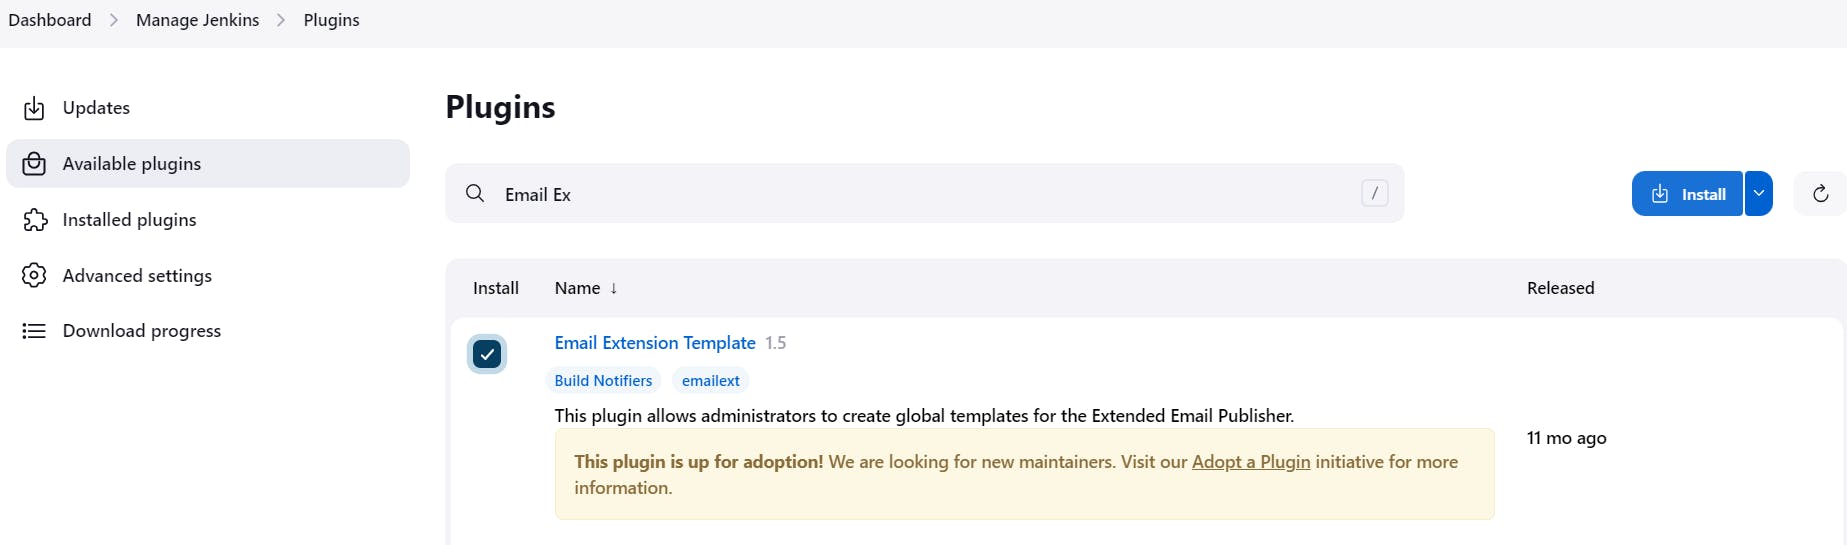
Step 6:- Email Integration With Jenkins and Plugin setup
Install Email Extension Plugin in Jenkins
Go to your Gmail and click on your profile
Then click on Manage Your Google Account –> click on the security tab on the left side panel you will get this page(provide mail password):-
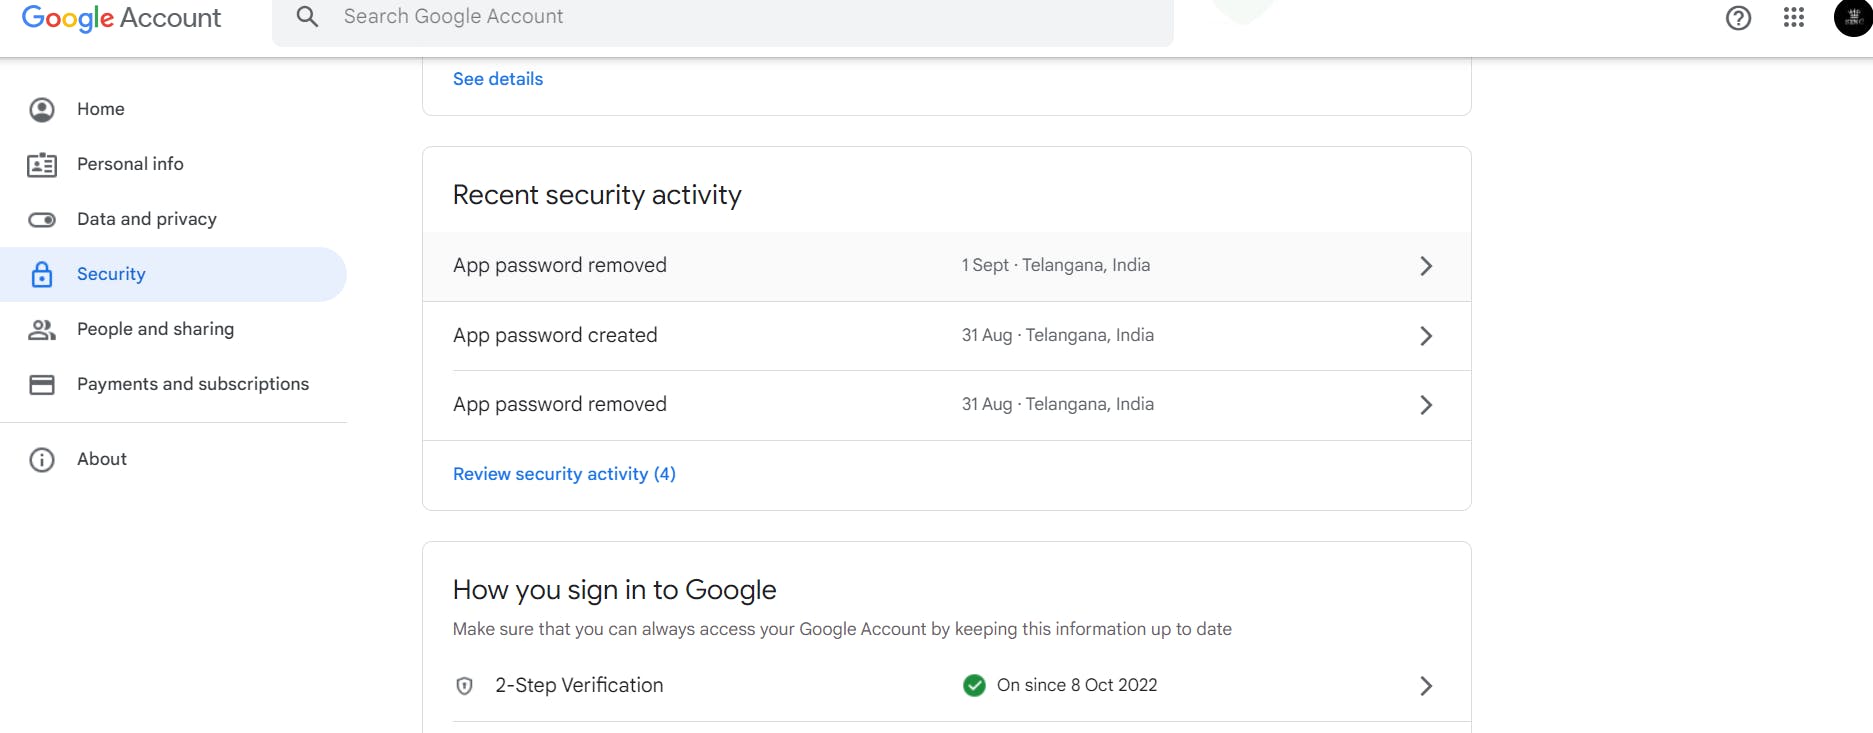
2-step verification should be enabled.
Search for the app in the search bar you will get app passwords like the below image:-
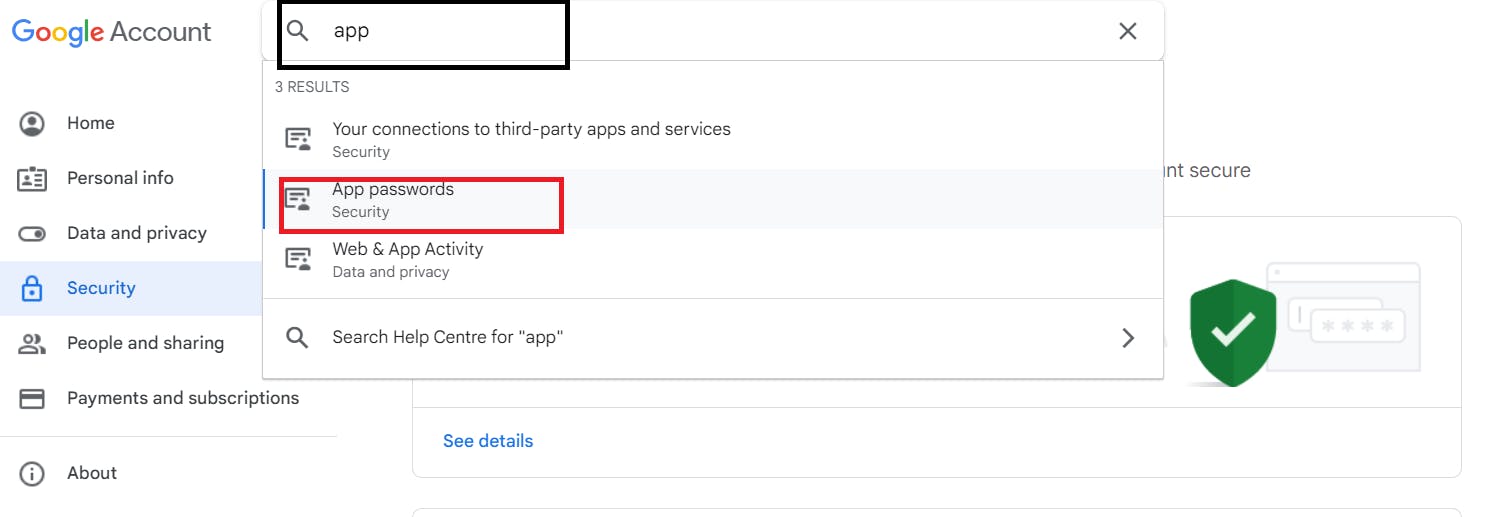
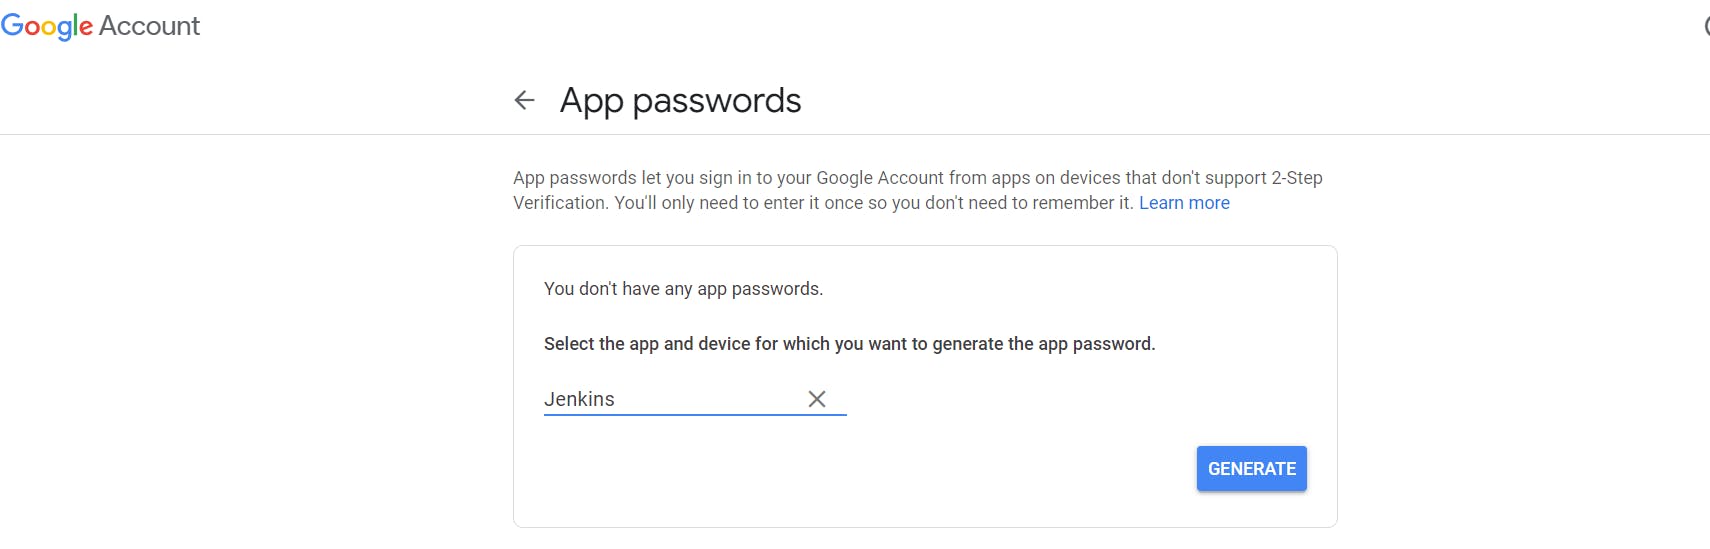
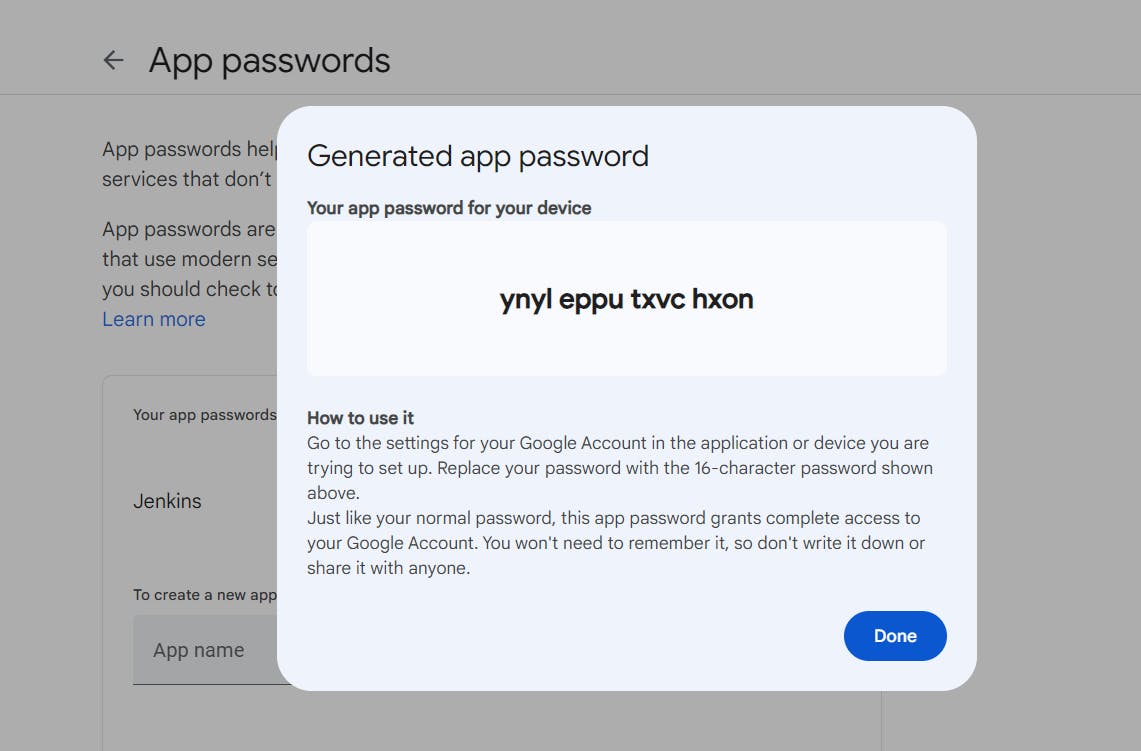
Click on other and provide your name and click on Generate and copy the password:-
Once the plugin is installed in Jenkins, click on manage Jenkins –> configure system there under the E-mail Notification section configure the details as shown in the below image:-
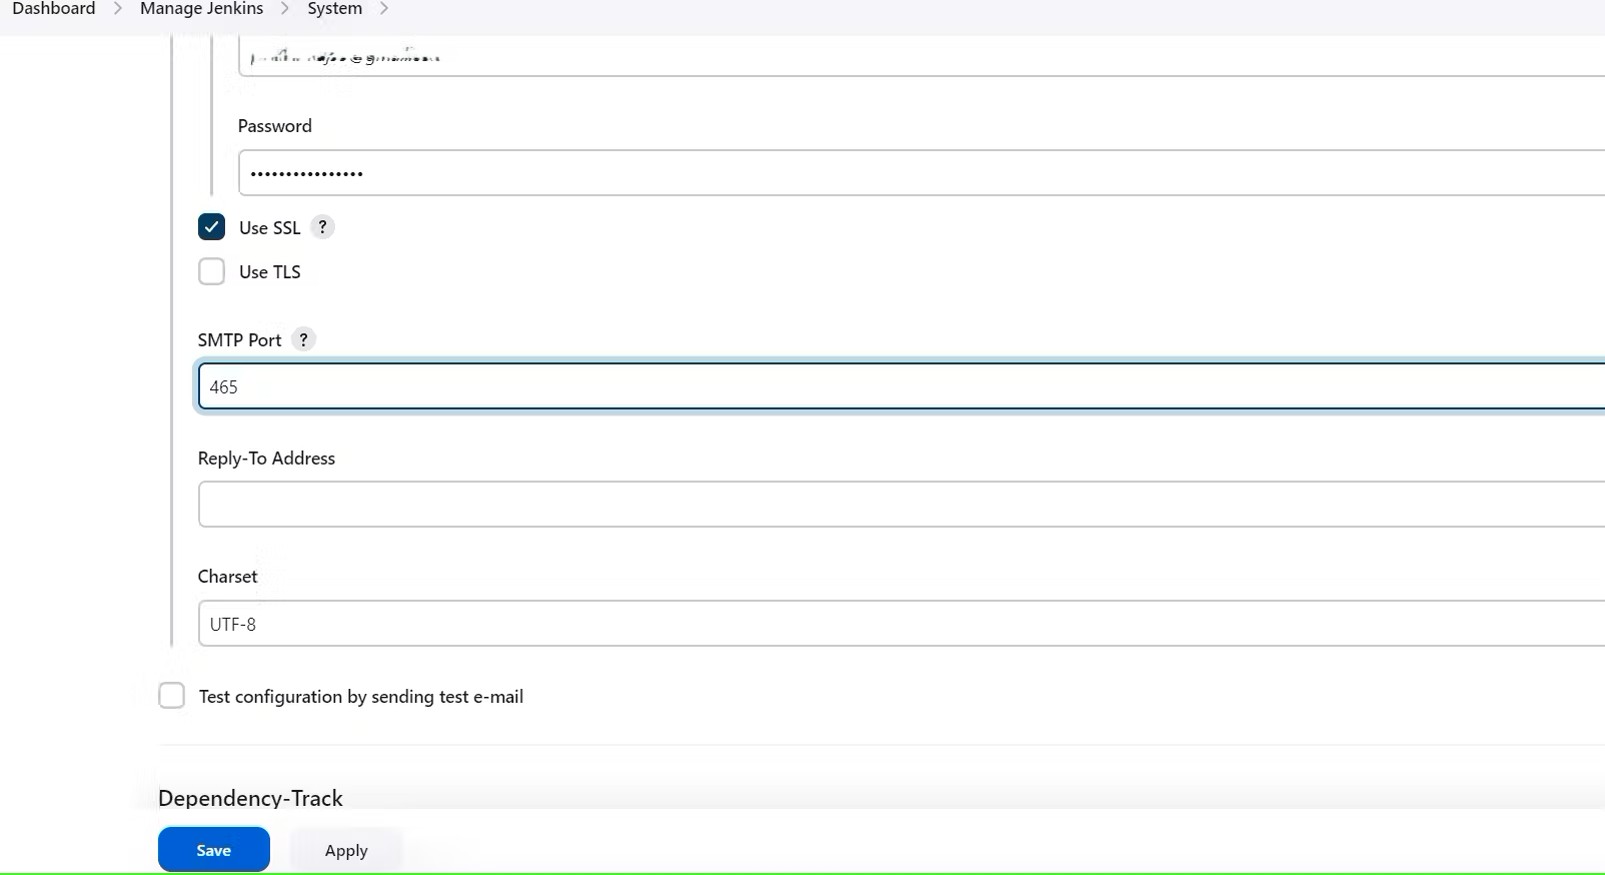
Click on Apply and save.
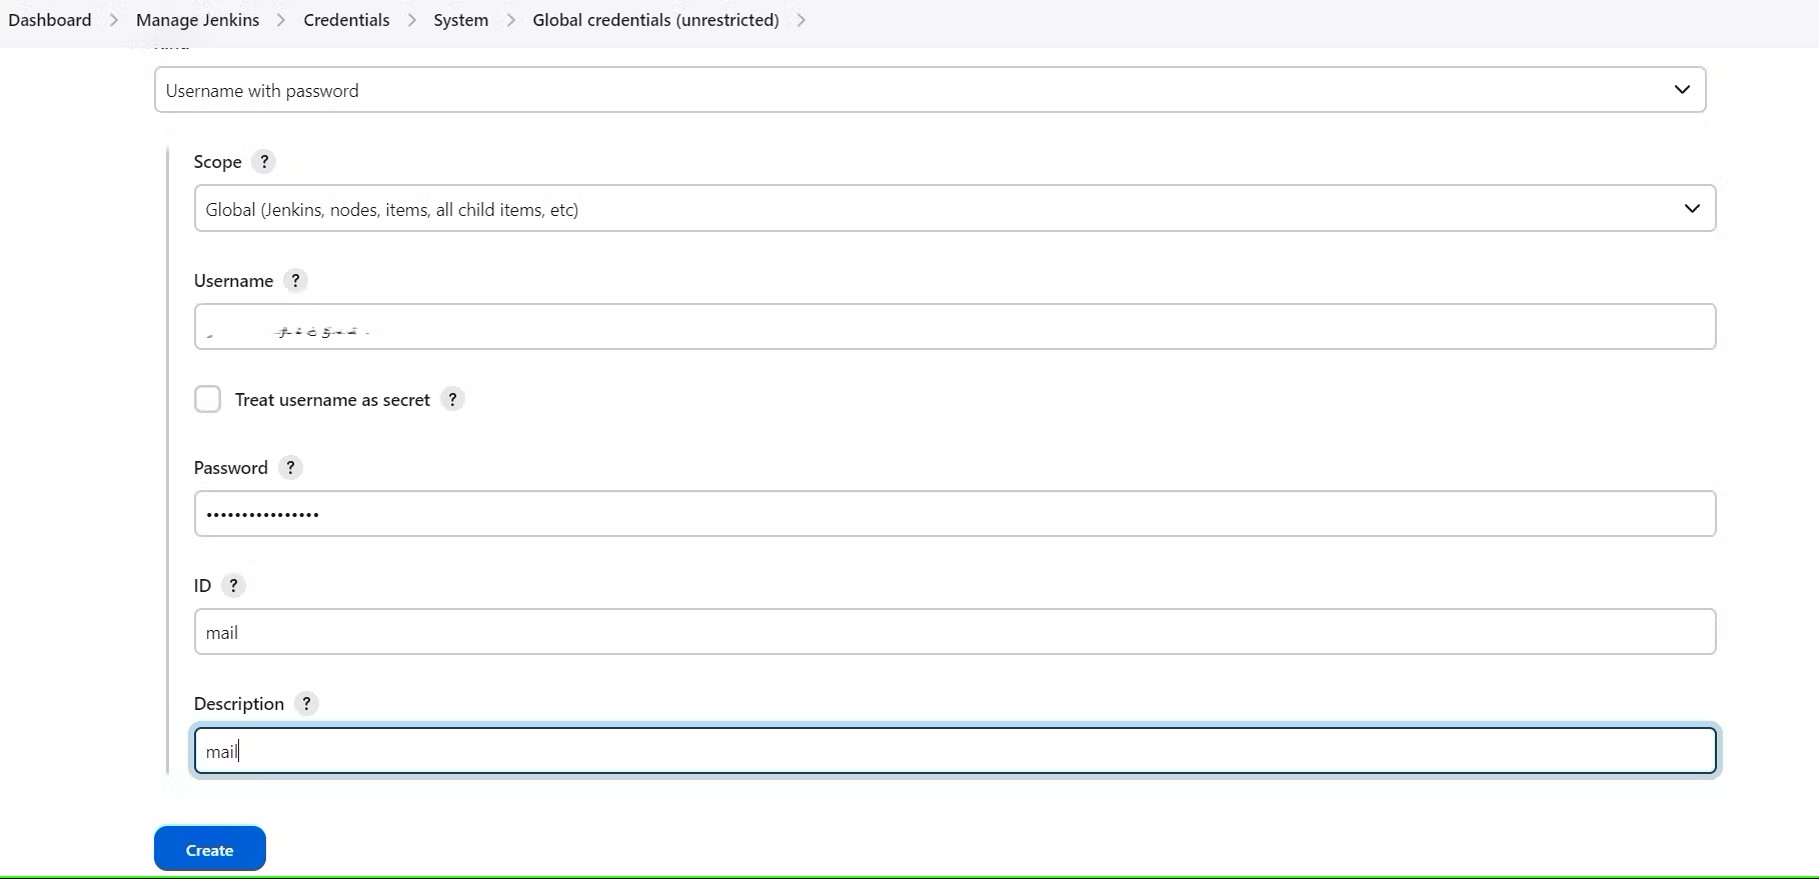
Click on Manage Jenkins–> credentials and add your mail username and generated password:-

This is to just verify the mail configuration
Now under the Extended E-mail Notification section configure the details as shown in the below images:-
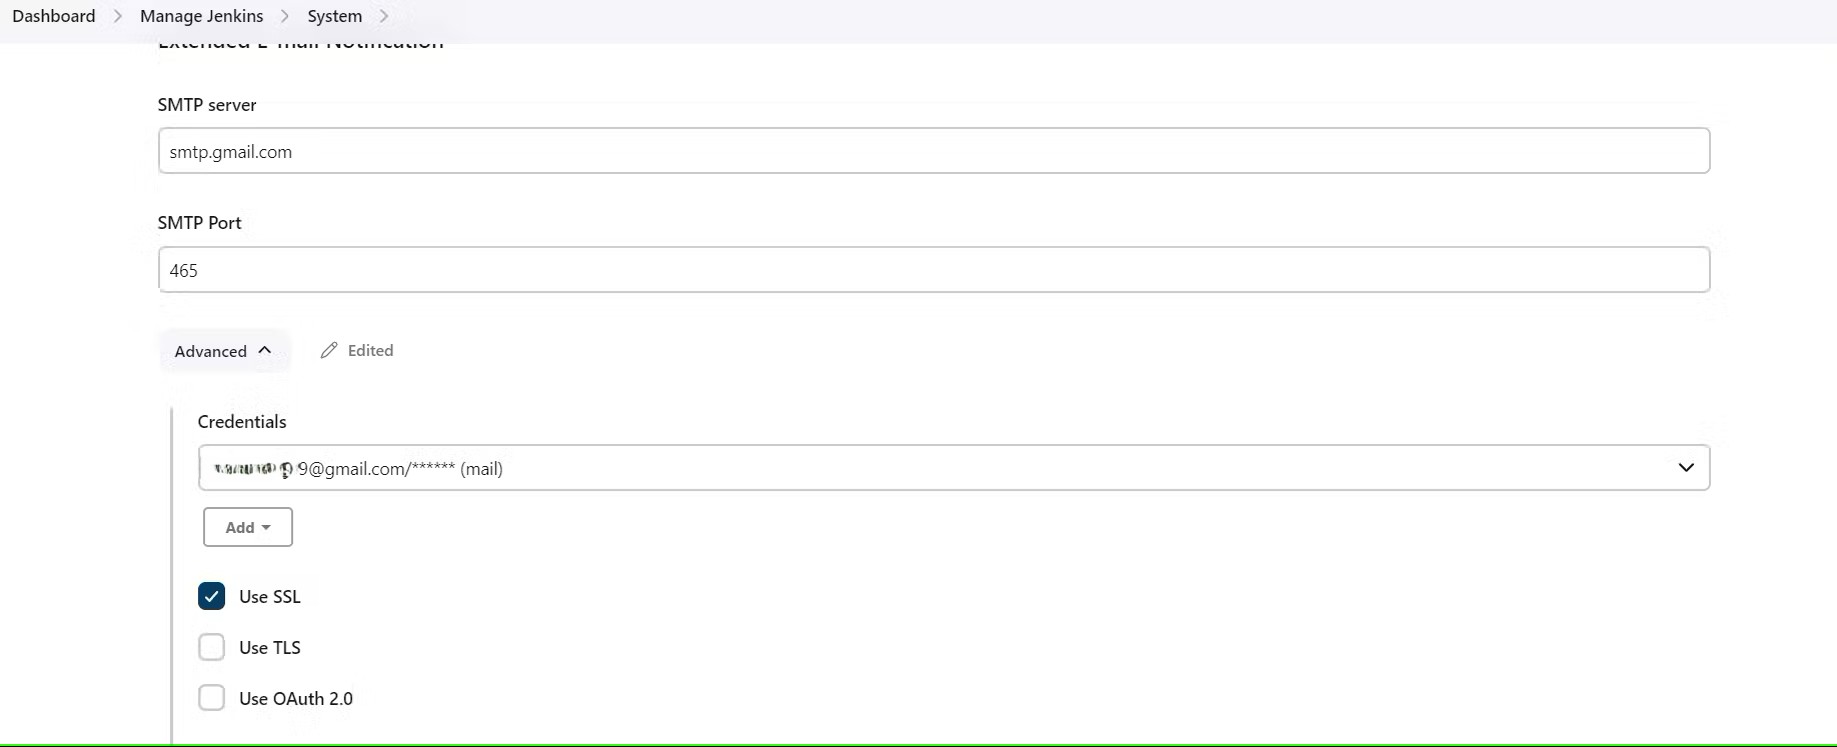
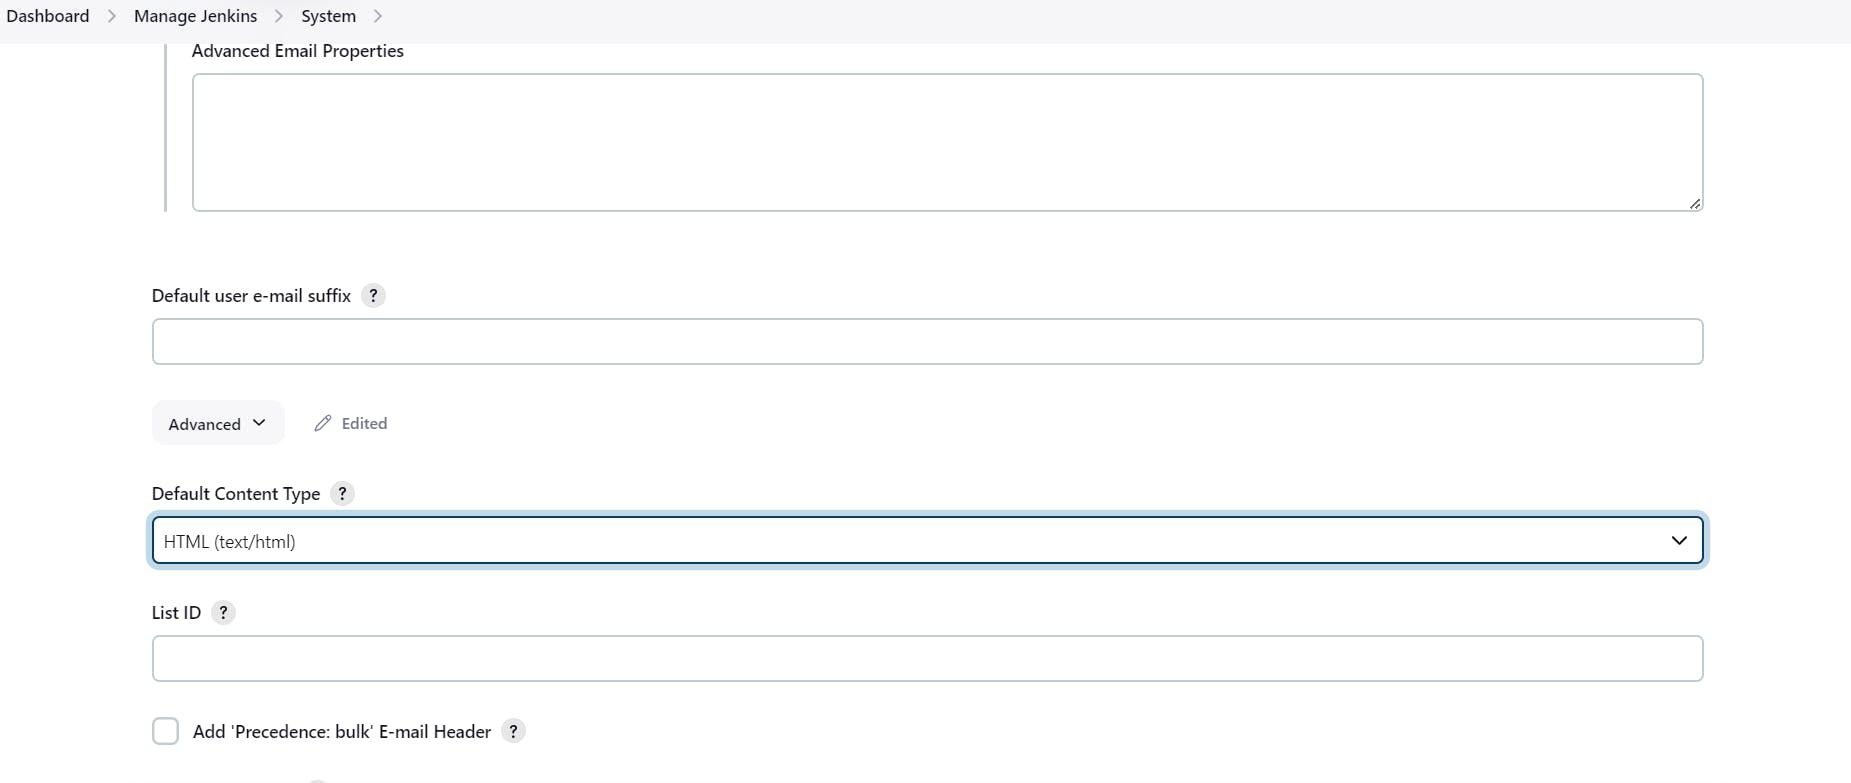
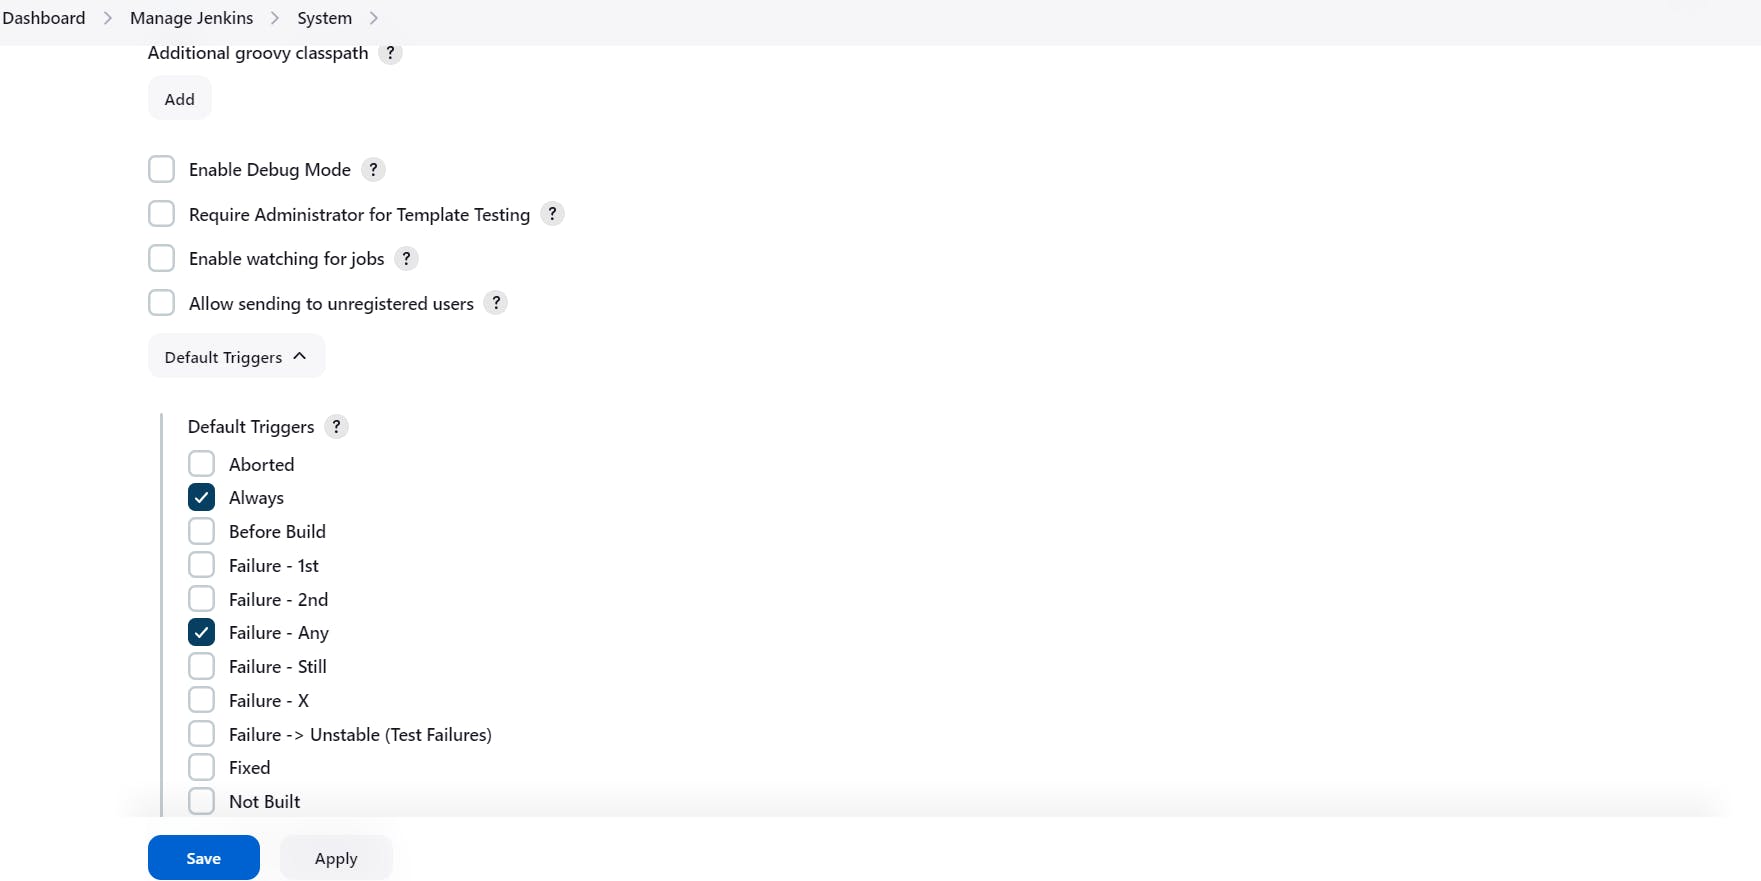
Click on Apply and save.
post {
     always {
        emailext attachLog: true,
            subject: "'${currentBuild.result}'",
            body: "Project: ${env.JOB_NAME}<br/>" +
                "Build Number: ${env.BUILD_NUMBER}<br/>" +
                "URL: ${env.BUILD_URL}<br/>",
            to: 'postbox.aj99@gmail.com',  #change Your mail
            attachmentsPattern: 'trivyfs.txt,trivyimage.txt'
        }
    }
Next, we will go in to Jenkins and start to configure our Pipeline in Jenkins
Step 7:- Install Plugins like JDK, Sonarqube Scanner, NodeJs, OWASP Dependency Check
7A:- Install Plugins
Goto Manage Jenkins →Plugins → Available Plugins →
Install below plugins
1 → Eclipse Temurin Installer (Install without restart)
2 → SonarQube Scanner (Install without restart)
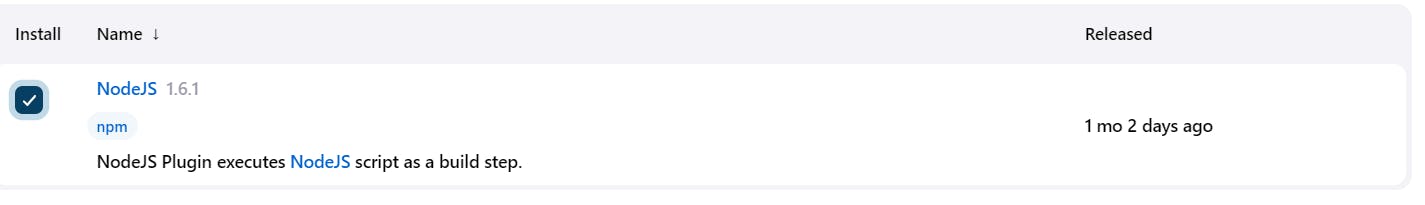
3 → NodeJs Plugin (Install Without restart)

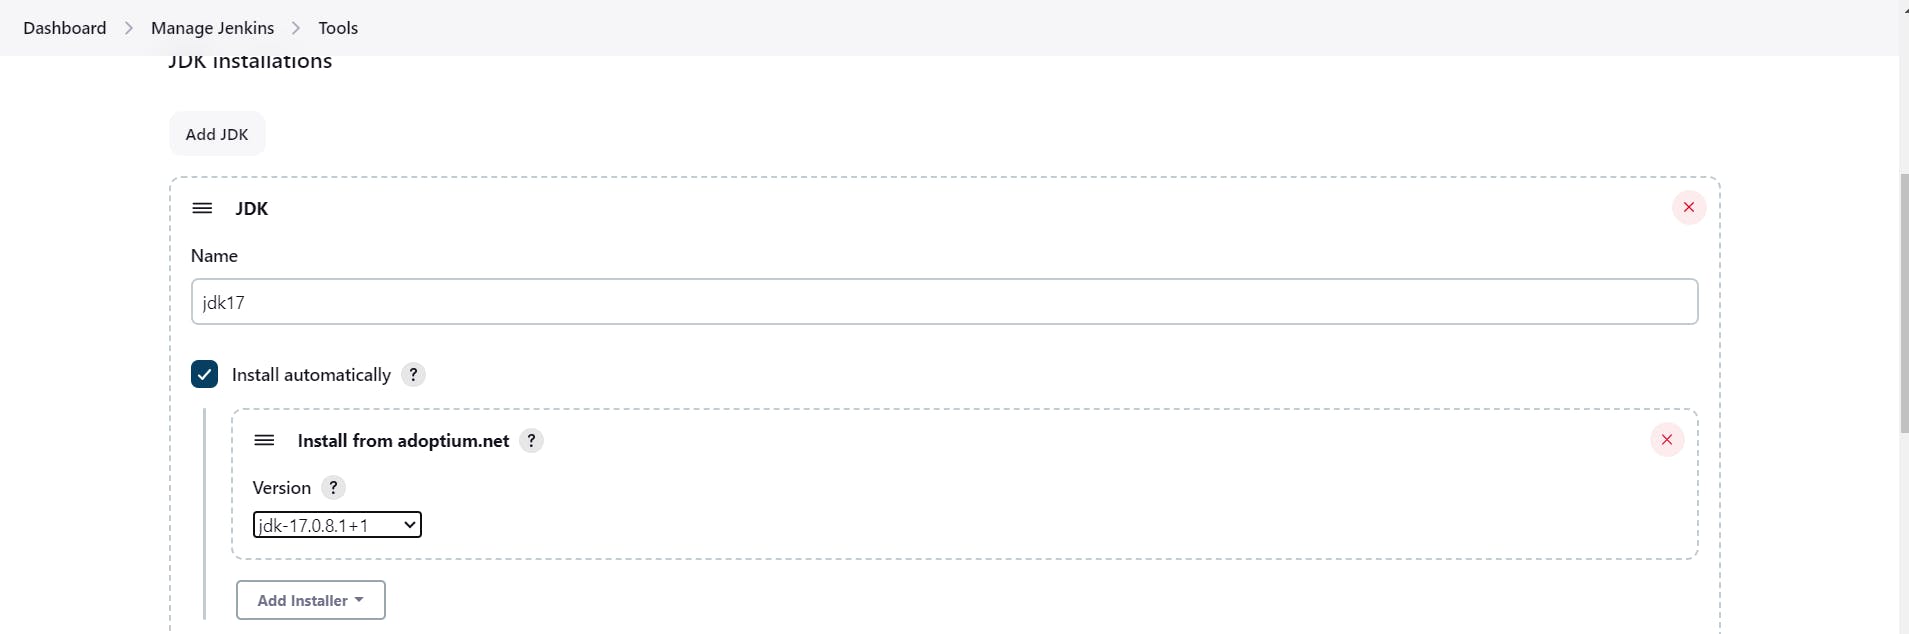
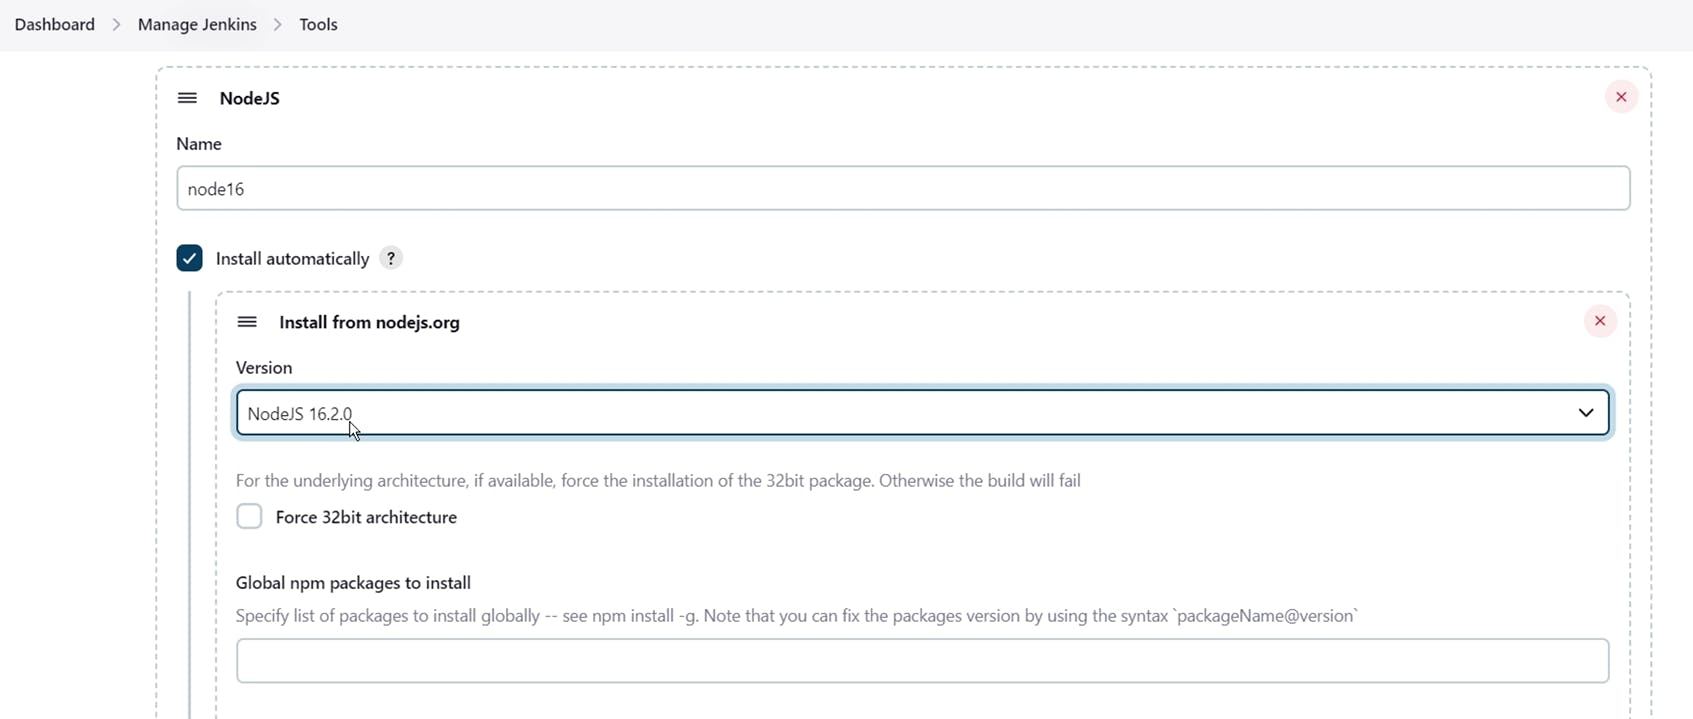
7B:- Configure Java and Nodejs in Global Tool Configuration
Goto Manage Jenkins → Tools → Install JDK(17) and NodeJs(16)→ Click on Apply and Save
7C:- Create a Job
Create a job and give the name of your choice, select pipeline and click on OK.
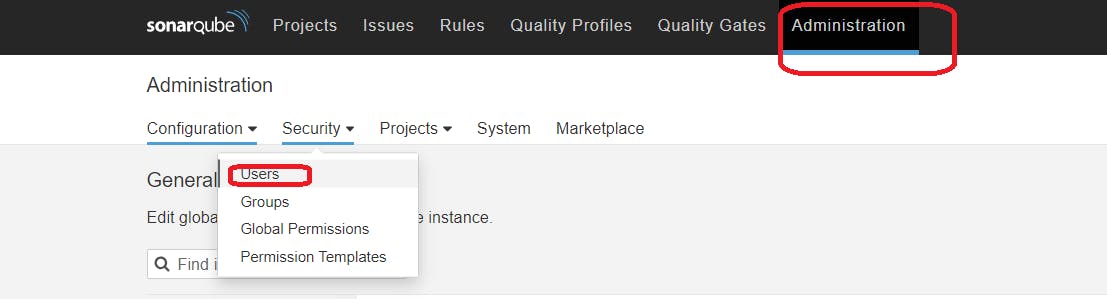
Step 8 — Configure SonarQube Server in Manage Jenkins
Grab the Public IP Address of your EC2 Instance, Sonarqube works on Port 9000, so <Public IP>:9000. Goto your Sonarqube Server. Click on Administration → Security → Users → Click on Tokens and Update Token → Give it a name → and click on Generate Token
click on update Token:-
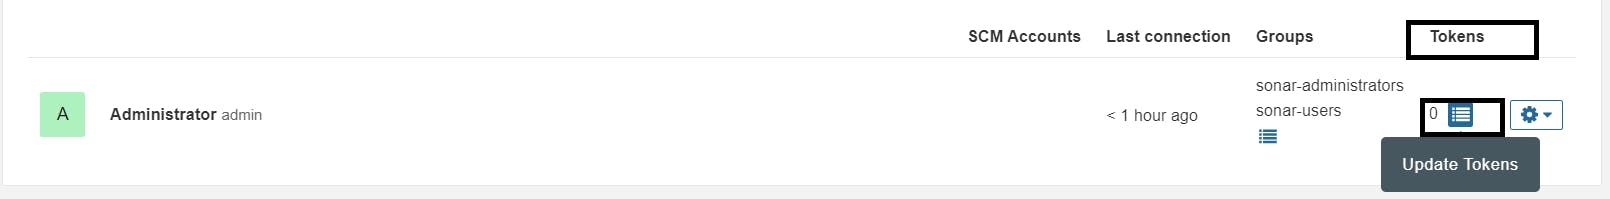
Create a token with a name and generate:-
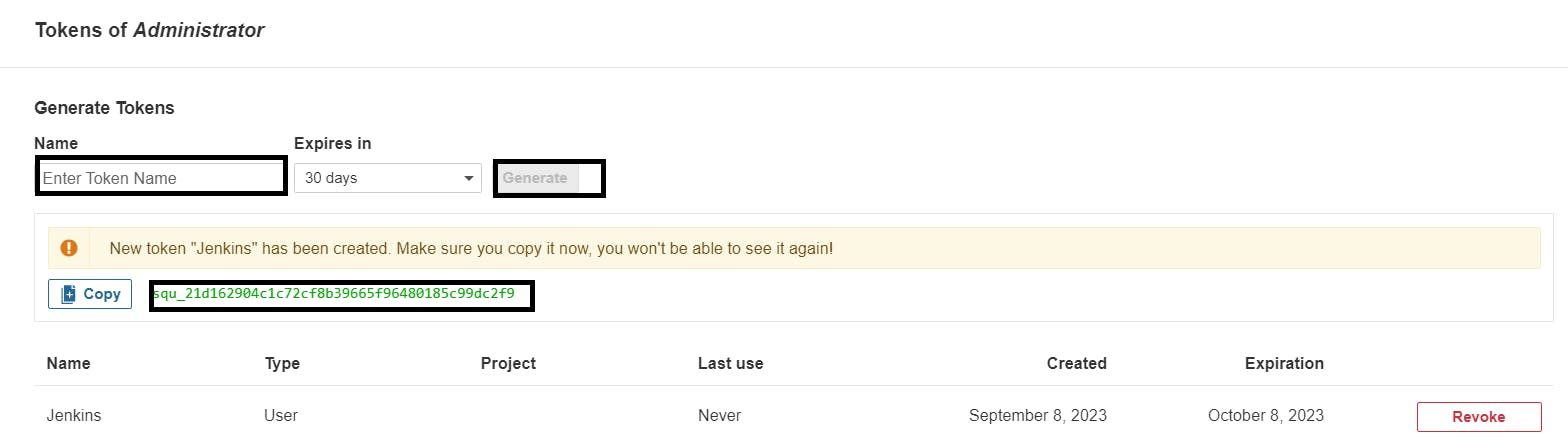
Copy Token.
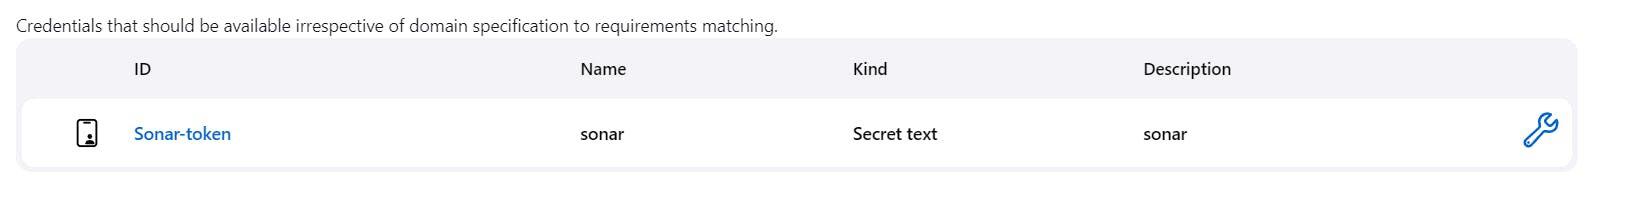
Then, go to Jenkins Dashboard → Manage Jenkins → Credentials → Add Secret Text. It should look like this:-
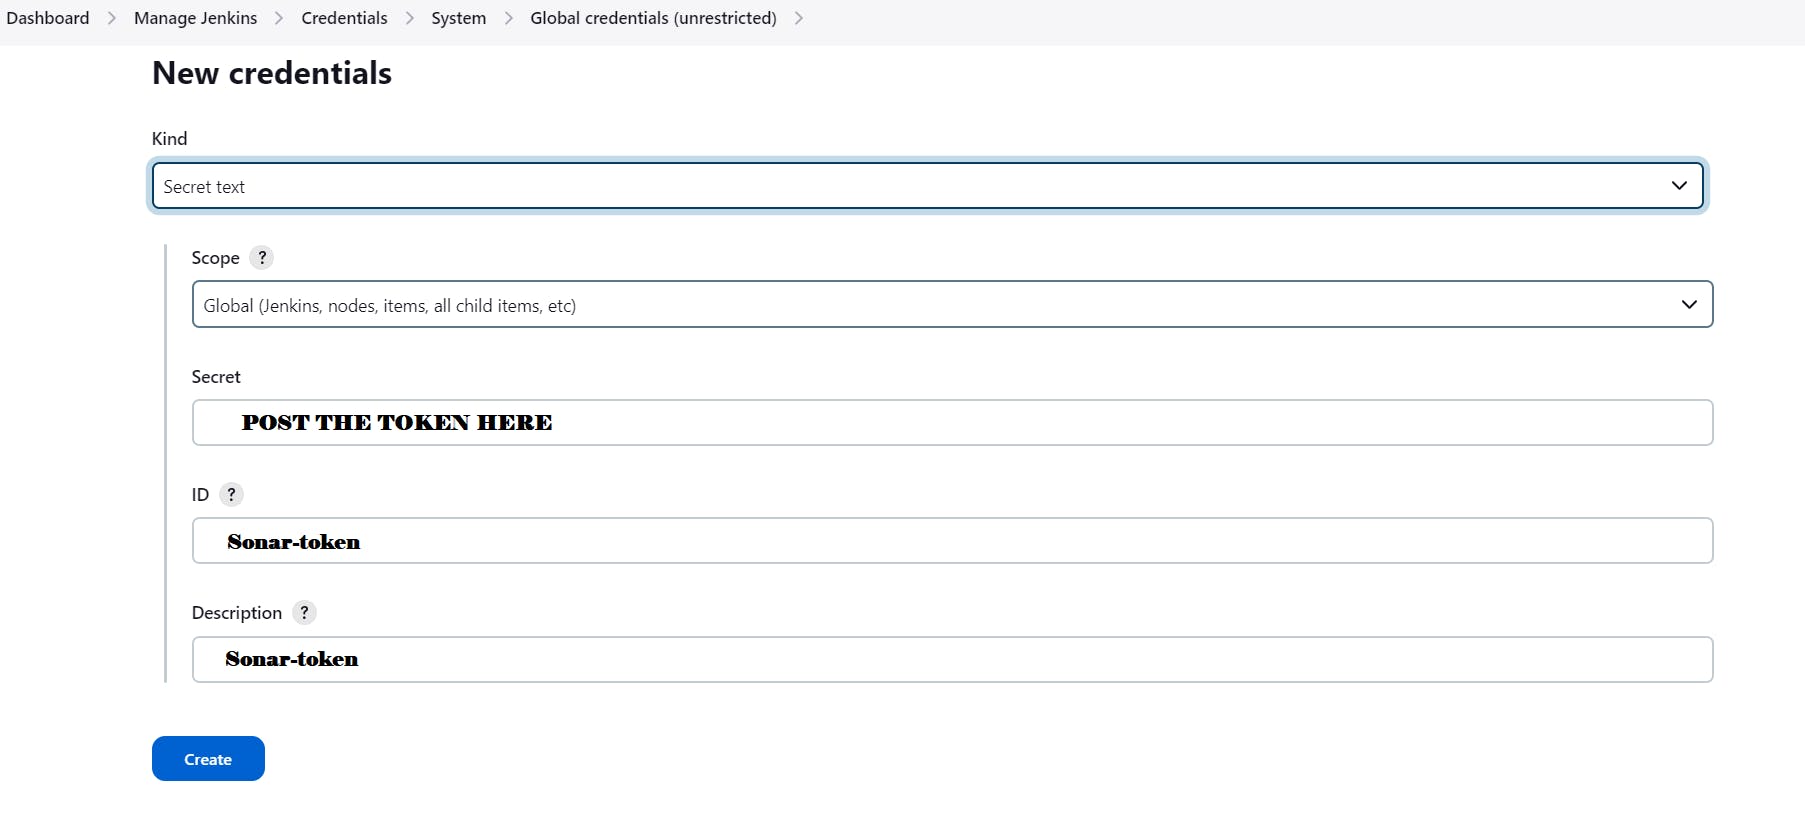
You will this page once you click on create:-
Now, go to Dashboard → Manage Jenkins → System and Add like the below image:-
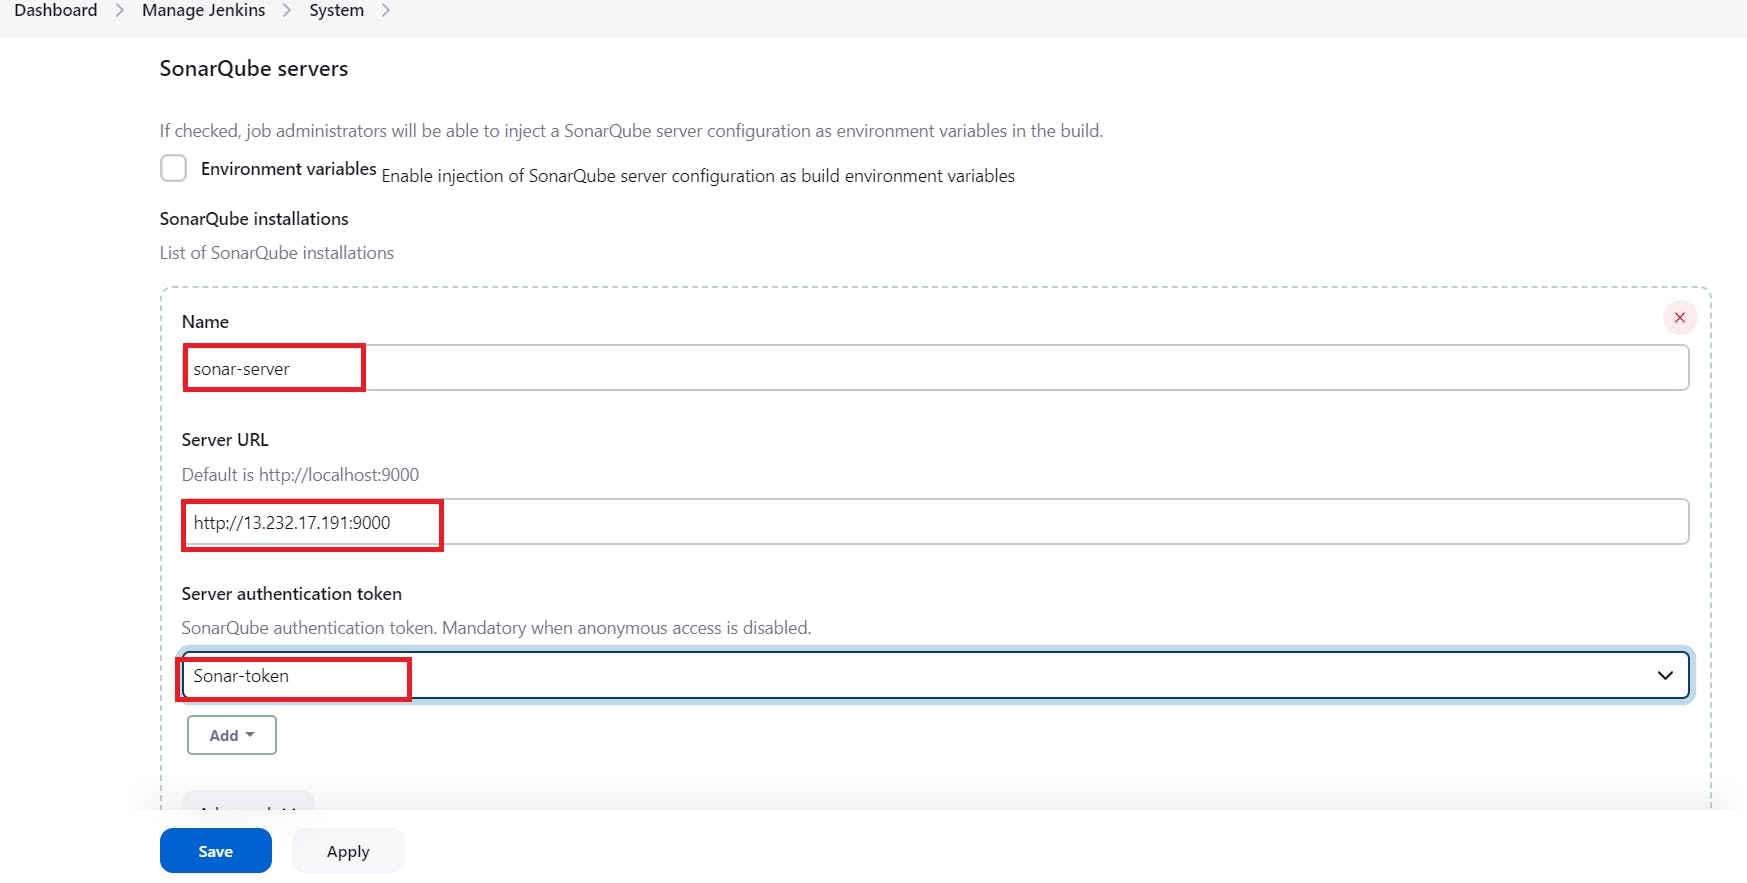
Click on Apply and Save
The Configure System option is used in Jenkins to configure different server
Global Tool Configuration is used to configure different tools that we install using Plugins
We will install a sonar scanner in the tools.

In the Sonarqube Dashboard add a quality gate also
Administration–> Configuration–>Webhooks
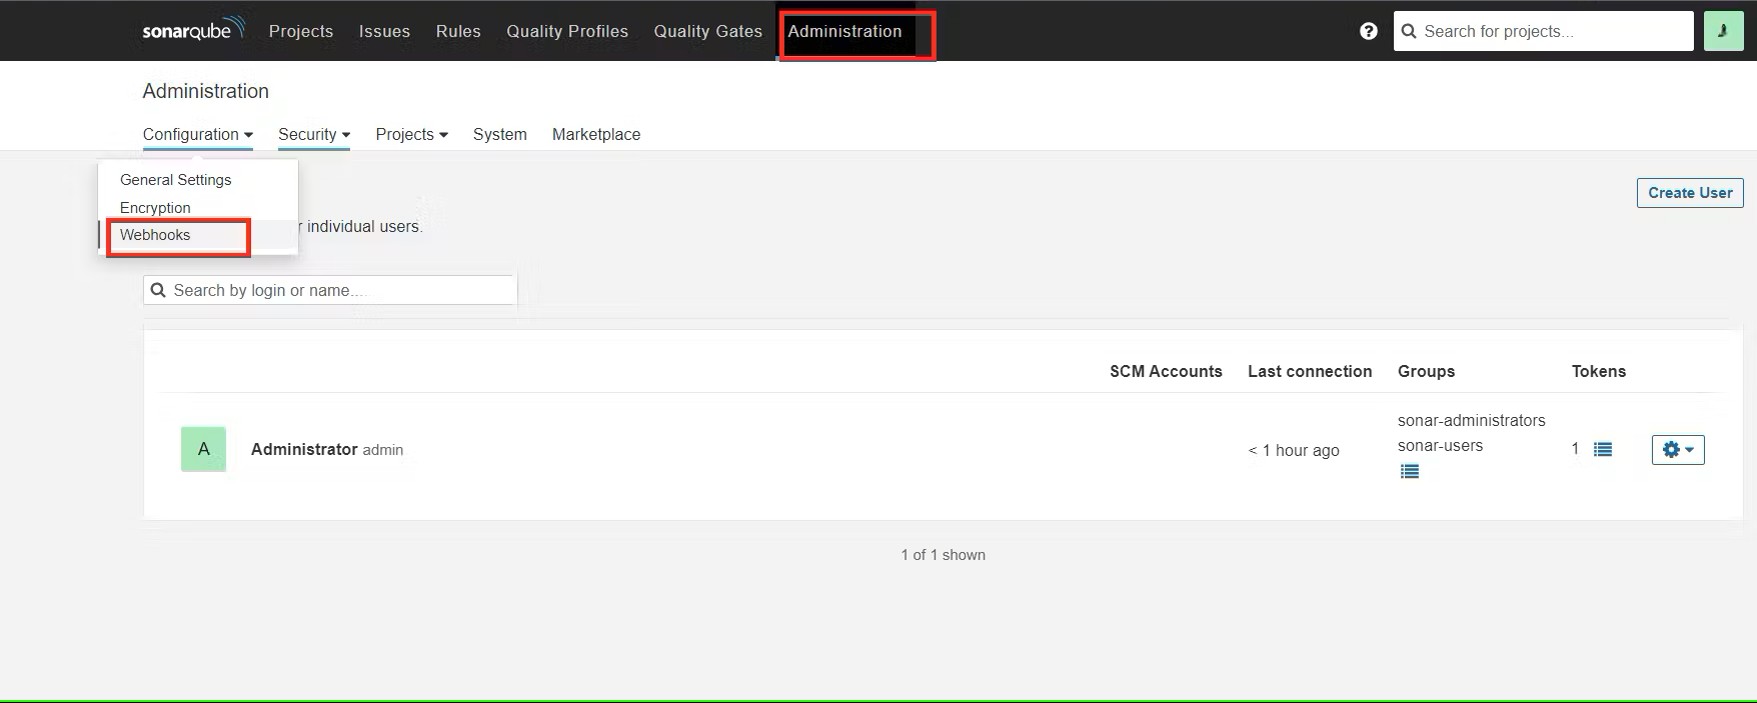
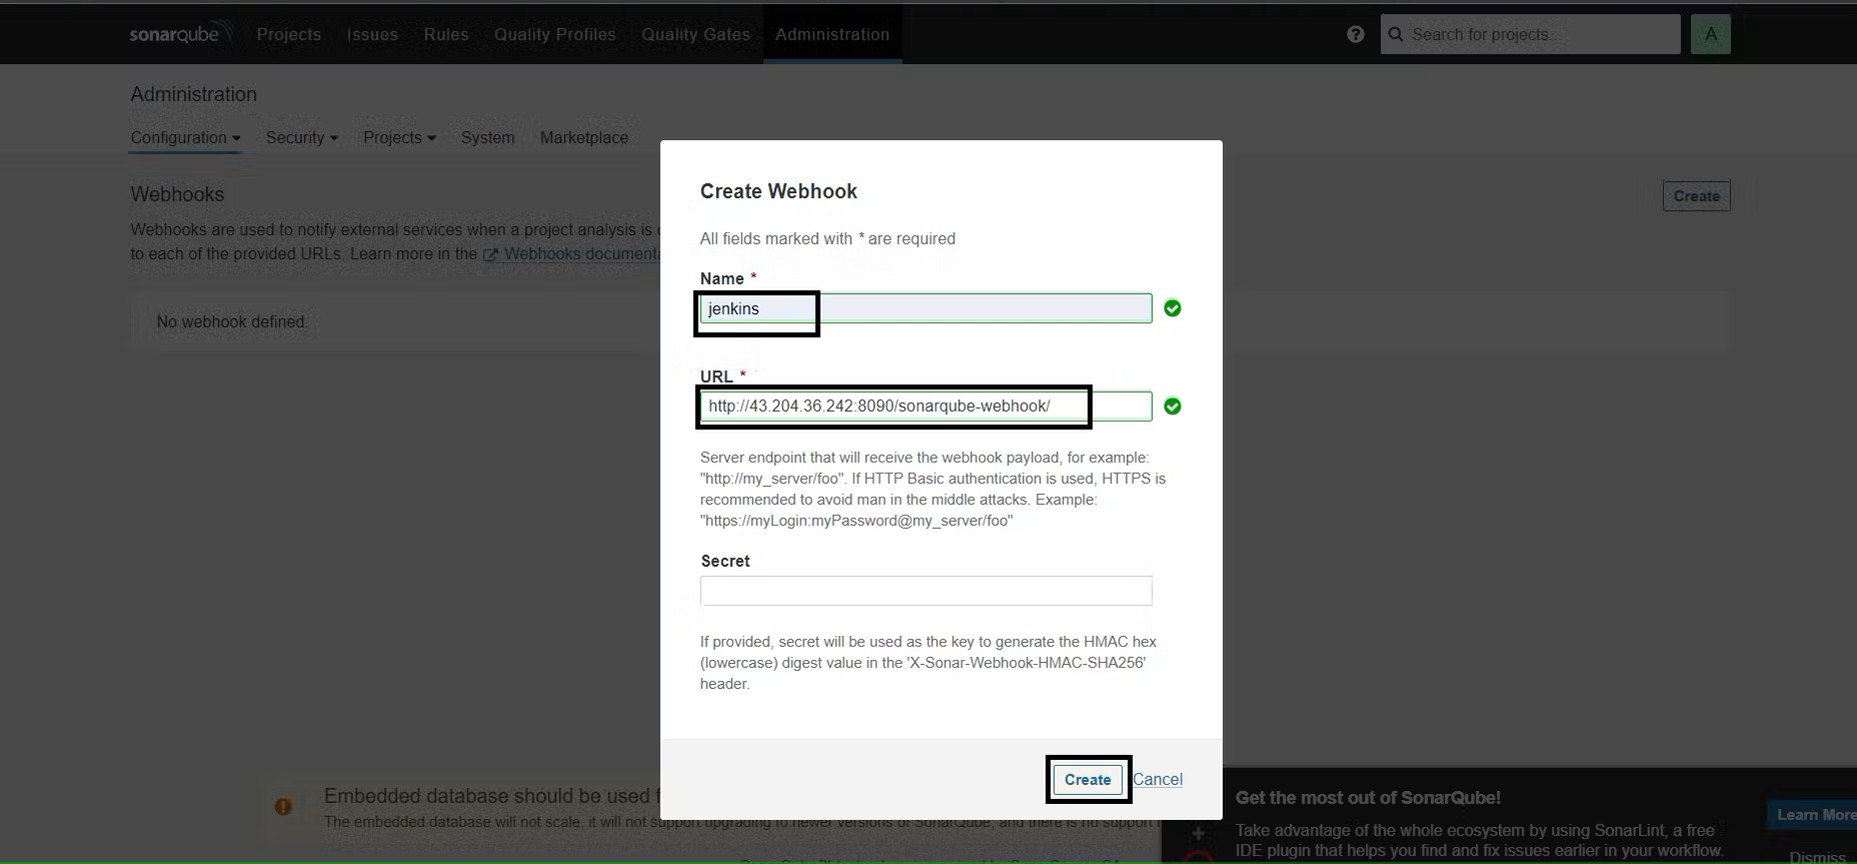
Click on Create:-

Now,
#in url section of quality gate
<http://jenkins-public-ip:8080>/sonarqube-webhook/
Let’s go to our Pipeline and add the script in our Pipeline Script:-
pipeline{
    agent any
    tools{
        jdk 'jdk17'
        nodejs 'node16'
    }
    environment {
        SCANNER_HOME=tool 'sonar-scanner'
    }
    stages {
        stage('clean workspace'){
            steps{
                cleanWs()
            }
        }
        stage('Checkout from Git'){
            steps{
                git branch: 'main', url: 'your_github_URL_here'
            }
        }
        stage("Sonarqube Analysis "){
            steps{
                withSonarQubeEnv('sonar-server') {
                    sh ''' $SCANNER_HOME/bin/sonar-scanner -Dsonar.projectName=Application \
                    -Dsonar.projectKey=Application ''' # you can change the name and key here
                }
            }
        }
        stage("quality gate"){
           steps {
                script {
                    waitForQualityGate abortPipeline: false, credentialsId: 'Sonar-token'
                }
            }
        }
        stage('Install Dependencies') {
            steps {
                sh "npm install"
            }
        }
    }
    post {
     always {
        emailext attachLog: true,
            subject: "'${currentBuild.result}'",
            body: "Project: ${env.JOB_NAME}<br/>" +
                "Build Number: ${env.BUILD_NUMBER}<br/>" +
                "URL: ${env.BUILD_URL}<br/>",
            to: 'your_mail_id@gmail.com',
            attachmentsPattern: 'trivyfs.txt,trivyimage.txt'
        }
    }
}
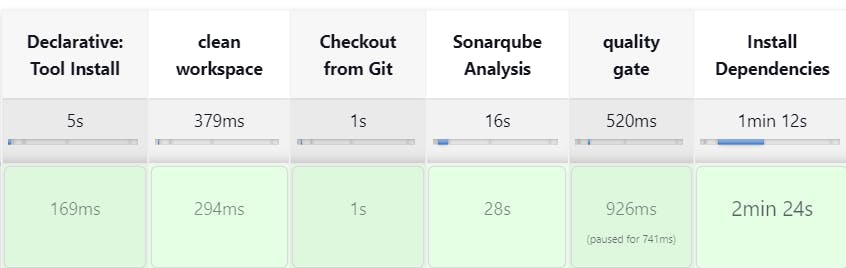
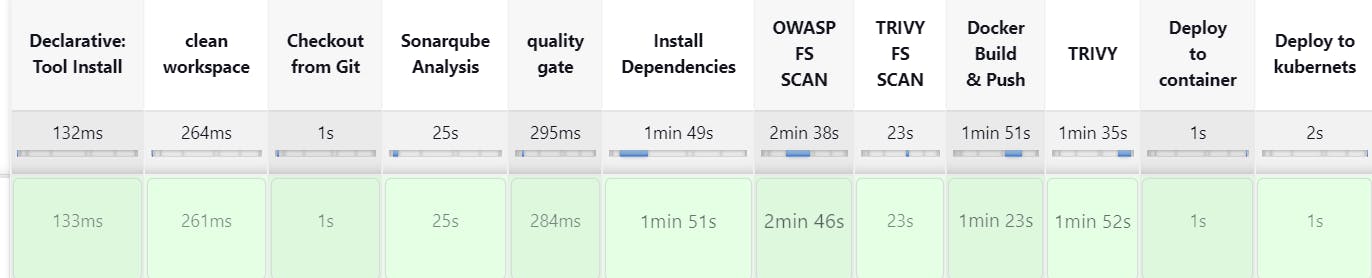
Click on Build now, you will see the stage view like this:-
To see the report, you can go to SonarQube Server and go to Projects:- (You will get the view of the SonarQube Report of your project like this)
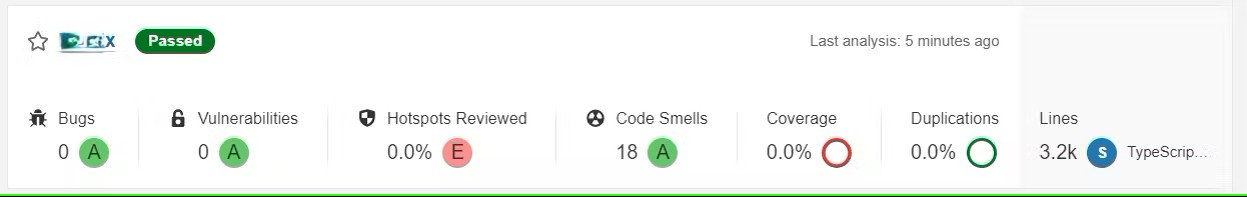
You can now see the report has been generated and the status shows as passed. Now, you can see that there are number of lines of code is scanned. To see a detailed report, you can go to issues.
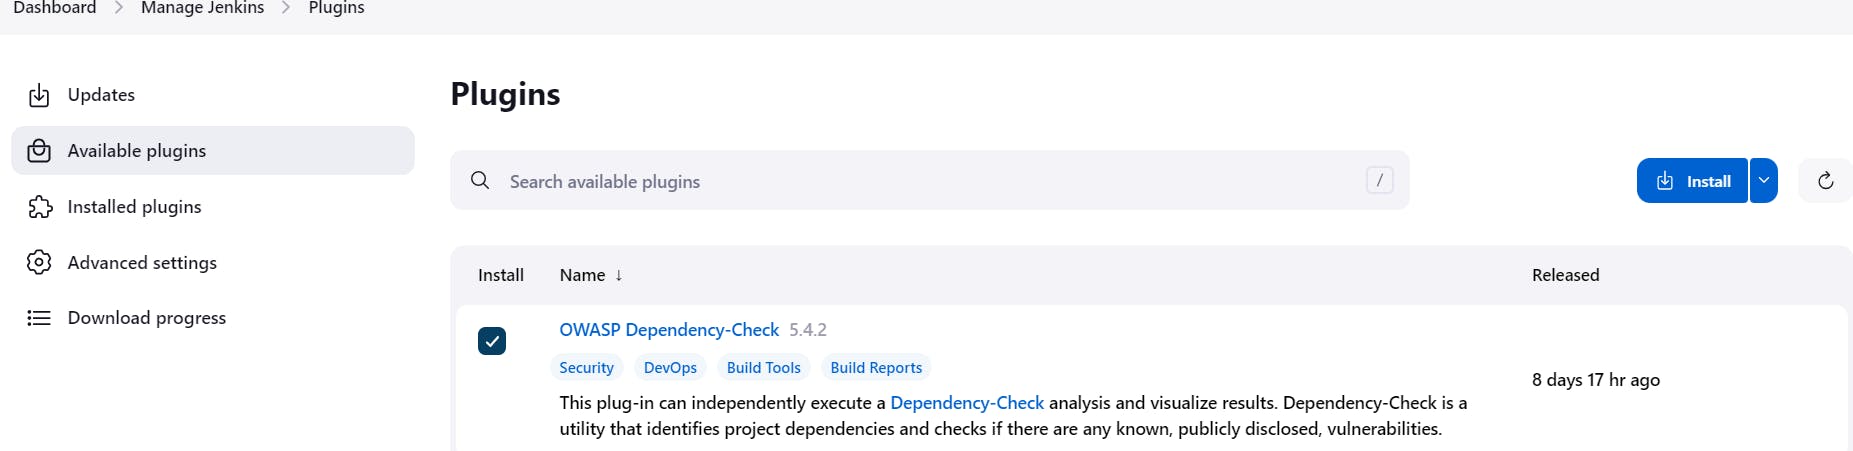
Step 9:- Install OWASP Dependency Check Plugins
GotoDashboard → Manage Jenkins → Plugins → OWASP Dependency-Check. Click on it and install it without restart.
First, we configured the Plugin and next, we had to configure the Tool
Goto Dashboard → Manage Jenkins → Tools →
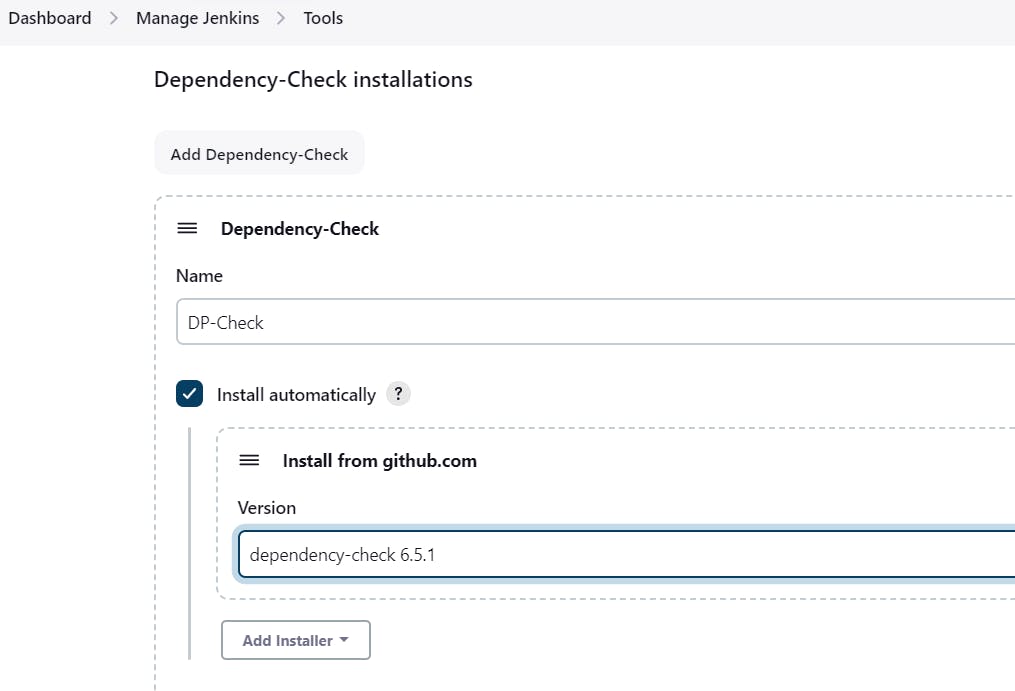
Click on Apply and Save here.
Now go configure → Pipeline and add this stage to your pipeline and build:-
stage('OWASP FS SCAN') {
            steps {
                dependencyCheck additionalArguments: '--scan ./ --disableYarnAudit --disableNodeAudit', odcInstallation: 'DP-Check'
                dependencyCheckPublisher pattern: '**/dependency-check-report.xml'
            }
        }
        stage('TRIVY FS SCAN') {
            steps {
                sh "trivy fs . > trivyfs.txt"
            }
        }
The stage view would look like this,
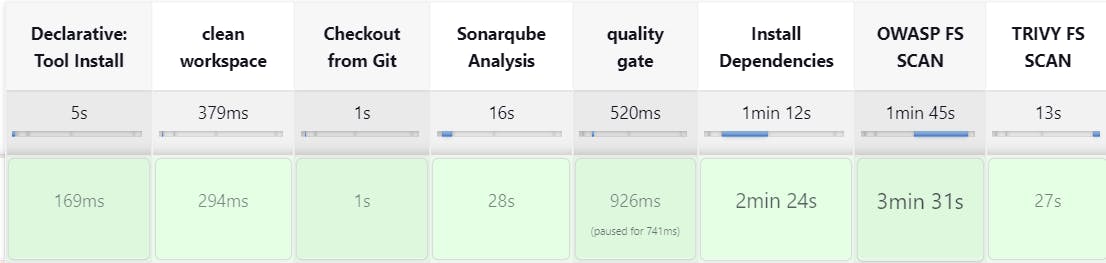
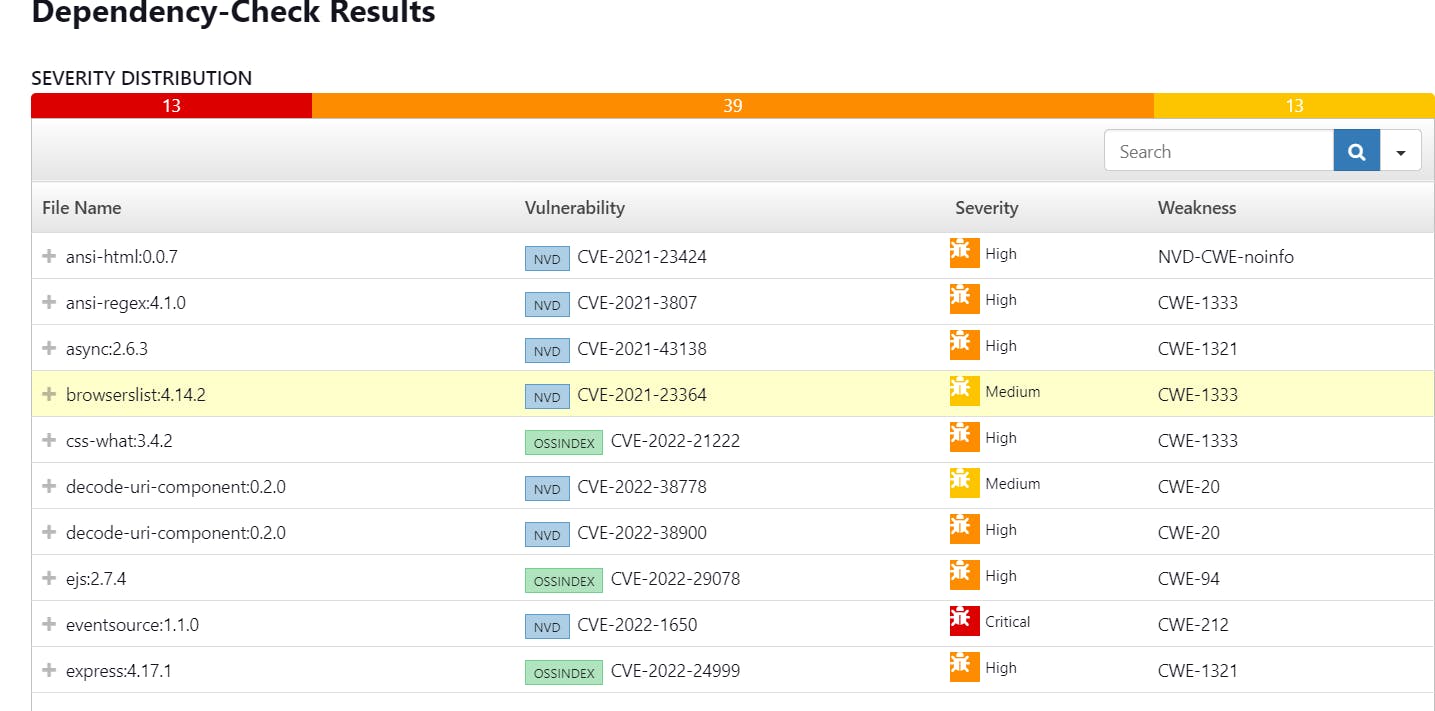
You will see that in status, a graph will also be generated and Vulnerabilities. (There might be a possibility that you will get the message of "No Vulnerabilities Found" but that is completely alright)
Step 10:- Docker Image Build and Push
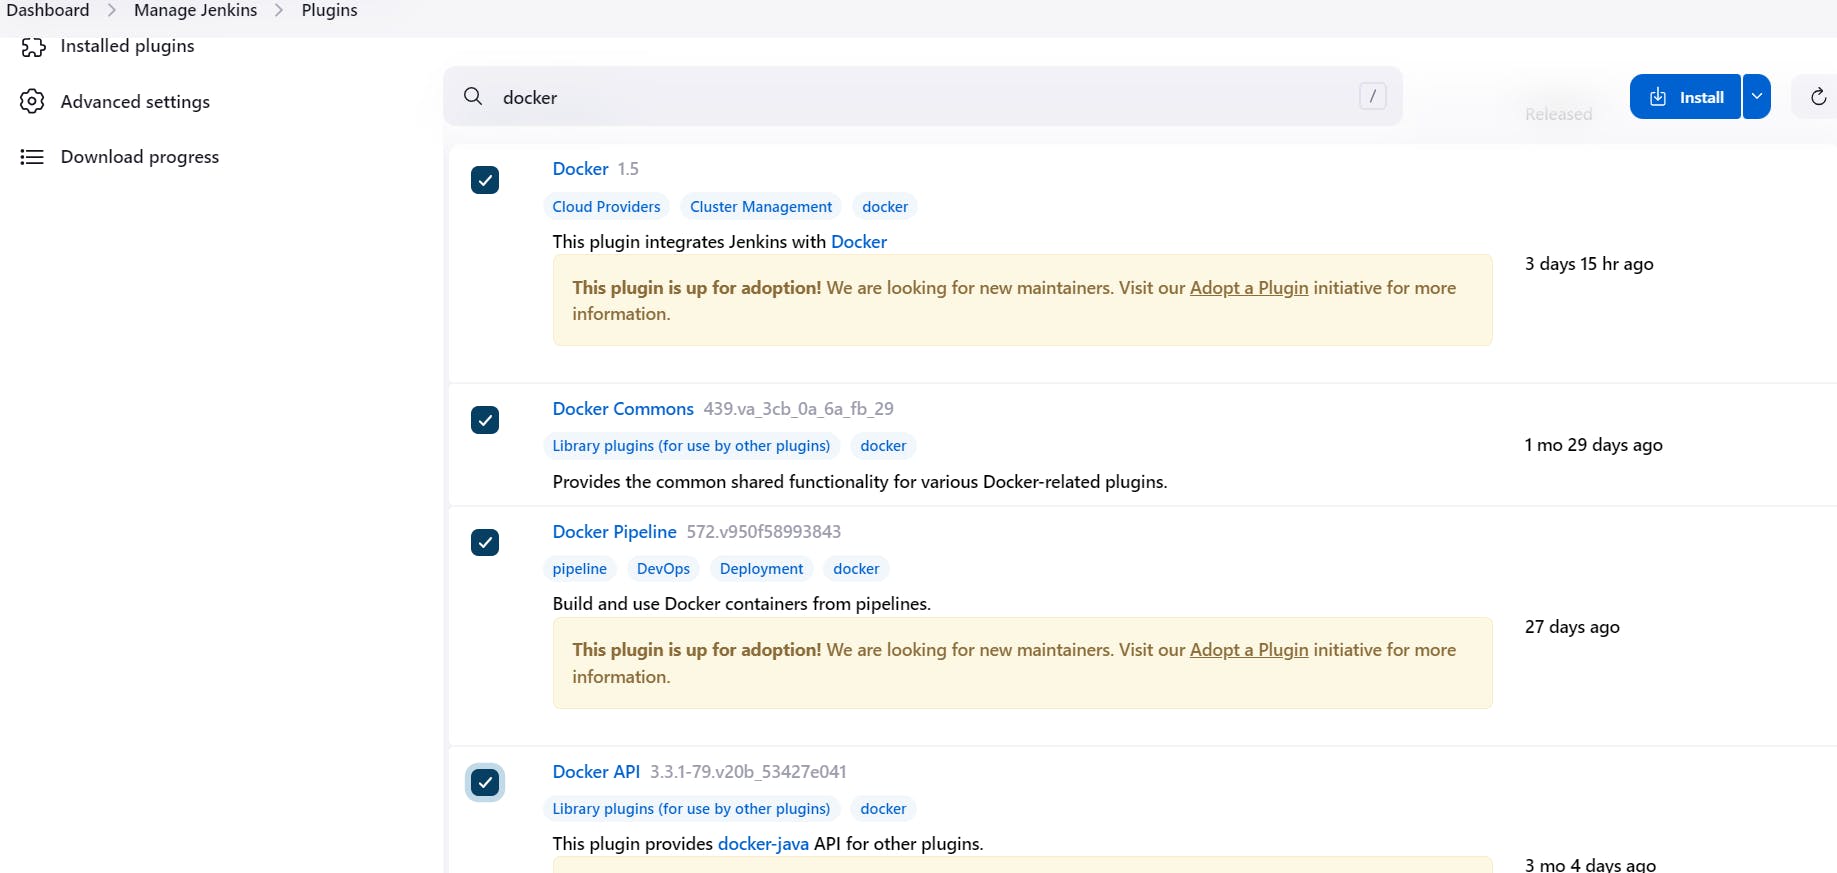
We need to install the Docker tool in our system, Goto Dashboard → Manage Plugins → Available plugins → Search for Docker and install these plugins:-
Docker
Docker Commons
Docker Pipeline
Docker API
docker-build-step
and click on install without restart
Now, goto Dashboard → Manage Jenkins → Tools →

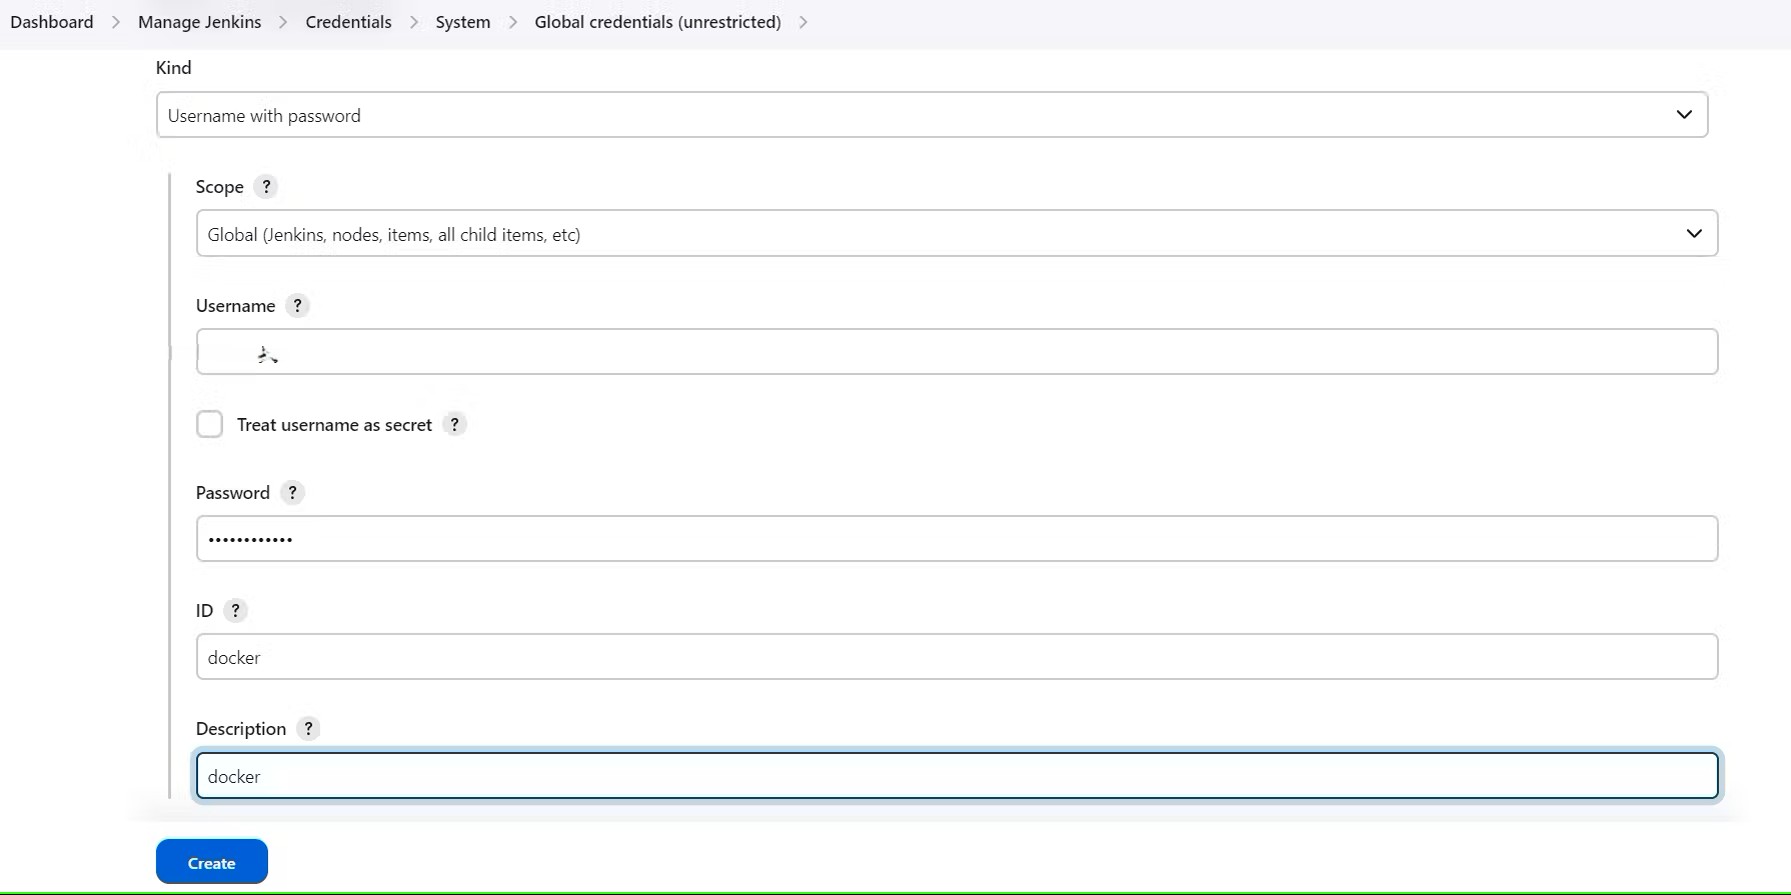
Add Docker Hub Username and Password under Global Credentials:- (you will be adding your Docker Hub username in the "USERNAME" section below)
Add this stage to Pipeline Script
stage("Docker Build & Push"){
            steps{
                script{
                   withDockerRegistry(credentialsId: 'docker', toolName: 'docker'){
                       sh "docker build --build-arg TMDB_V3_API_KEY=<API-key-here> -t netflix ."
                       sh "docker tag netflix yash5090/netflix:latest "
                       sh "docker push yash5090/netflix:latest "
                    }
                }
            }
        }
        stage("TRIVY"){
            steps{
                sh "trivy image yash5090/netflix:latest > trivyimage.txt"
            }
        }
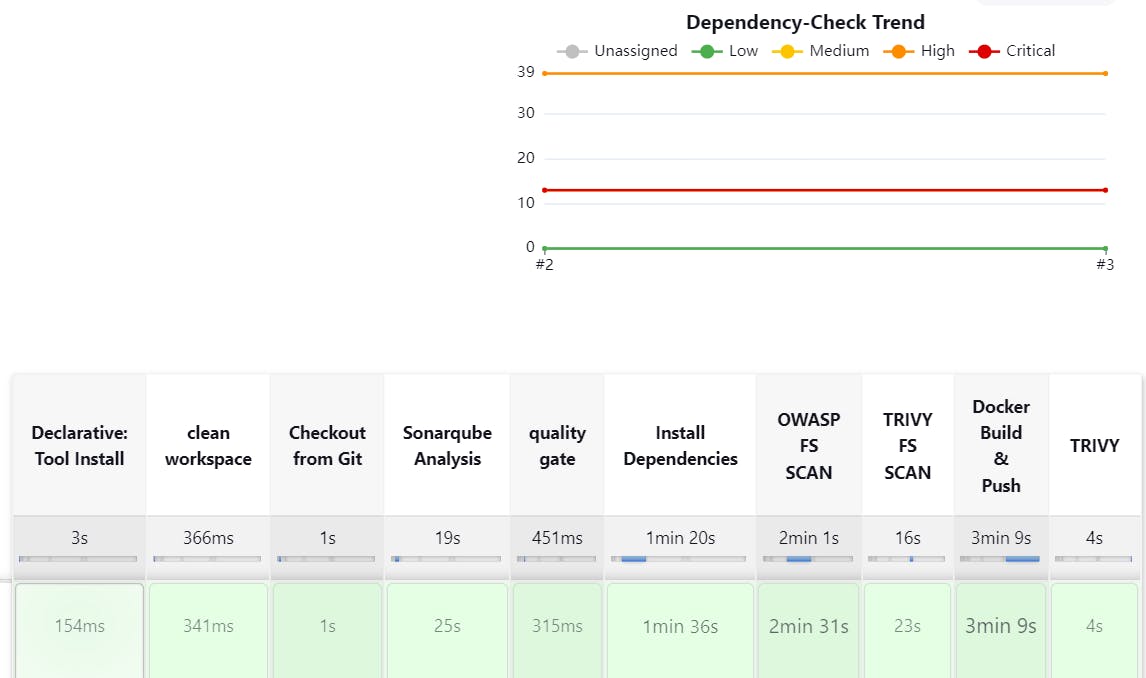
You will see the output below, with a dependency trend:-
When you log in to Docker Hub, you will see a new image is created.
Step 11:- Deploy the image using Docker
Now Run the container to see if it is coming up or not by adding the below stage:-
stage('Deploy to container'){
            steps{
                sh 'docker run -d --name netflix -p 8081:80 yash5090/netflix:latest'
            }
        }
Stage View will be like this:-
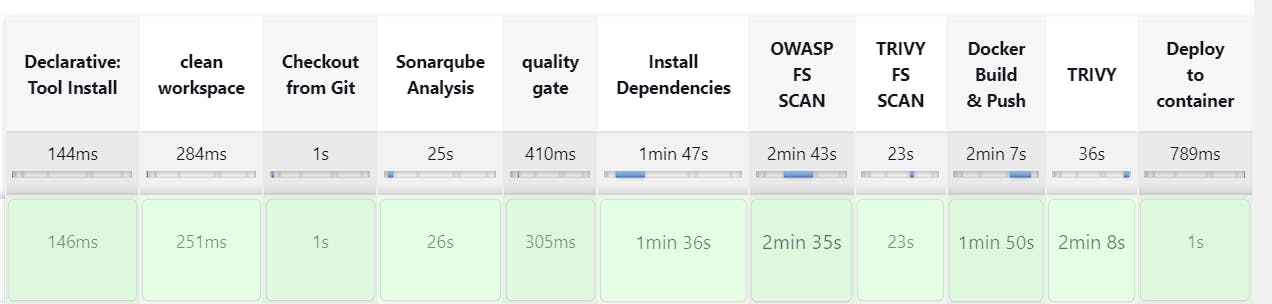
On getting the above successful Output, use your <Jenkins-public-ip:8081>
And, you will get this output

Step 12 —> Kubernetes Master and Slave server setup on Ubuntu (20.04)
Take-Two Ubuntu 20.04 instances one for k8s master and the other one for worker.
Install Kubectl on Jenkins machine also.
Kubectl is to be installed on Jenkins also
sudo apt update
sudo apt install curl
curl -LO https://dl.k8s.io/release/$(curl -L -s https://dl.k8s.io/release/stable.txt)/bin/linux/amd64/kubectl
sudo install -o root -g root -m 0755 kubectl /usr/local/bin/kubectl
kubectl version --client
Part 1:- Master Node
sudo hostnamectl set-hostname K8s-Master
Worker Node
sudo hostnamectl set-hostname K8s-Worker
Part 2:- Both Master & Worker Node
sudo apt-get update
sudo apt-get install -y docker.io
sudo usermod –aG docker Ubuntu
newgrp docker
sudo chmod 777 /var/run/docker.sock
sudo apt-get update
sudo apt-get install -y apt-transport-https ca-certificates curl gpg
curl -fsSL https://pkgs.k8s.io/core:/stable:/v1.29/deb/Release.key | sudo gpg --dearmor -o /etc/apt/keyrings/kubernetes-apt-keyring.gpg
echo 'deb [signed-by=/etc/apt/keyrings/kubernetes-apt-keyring.gpg] https://pkgs.k8s.io/core:/stable:/v1.29/deb/ /' | sudo tee /etc/apt/sources.list.d/kubernetes.list
sudo apt-get update
sudo apt-get install -y kubelet kubeadm kubectl
sudo apt-mark hold kubelet kubeadm kubectl
Part 3:- k8s Master
sudo kubeadm init --pod-network-cidr=10.244.0.0/16
# in case your in root exit from it and run below commands
mkdir -p $HOME/.kube
sudo cp -i /etc/kubernetes/admin.conf $HOME/.kube/config
sudo chown $(id -u):$(id -g) $HOME/.kube/config
kubectl apply -f https://raw.githubusercontent.com/coreos/flannel/master/Documentation/kube-flannel.yml
———-Worker Node————
sudo kubeadm join <master-node-ip>:<master-node-port> --token <token> --discovery-token-ca-cert-hash <hash>
Copy the config file to Jenkins master or the local file manager and save it:-
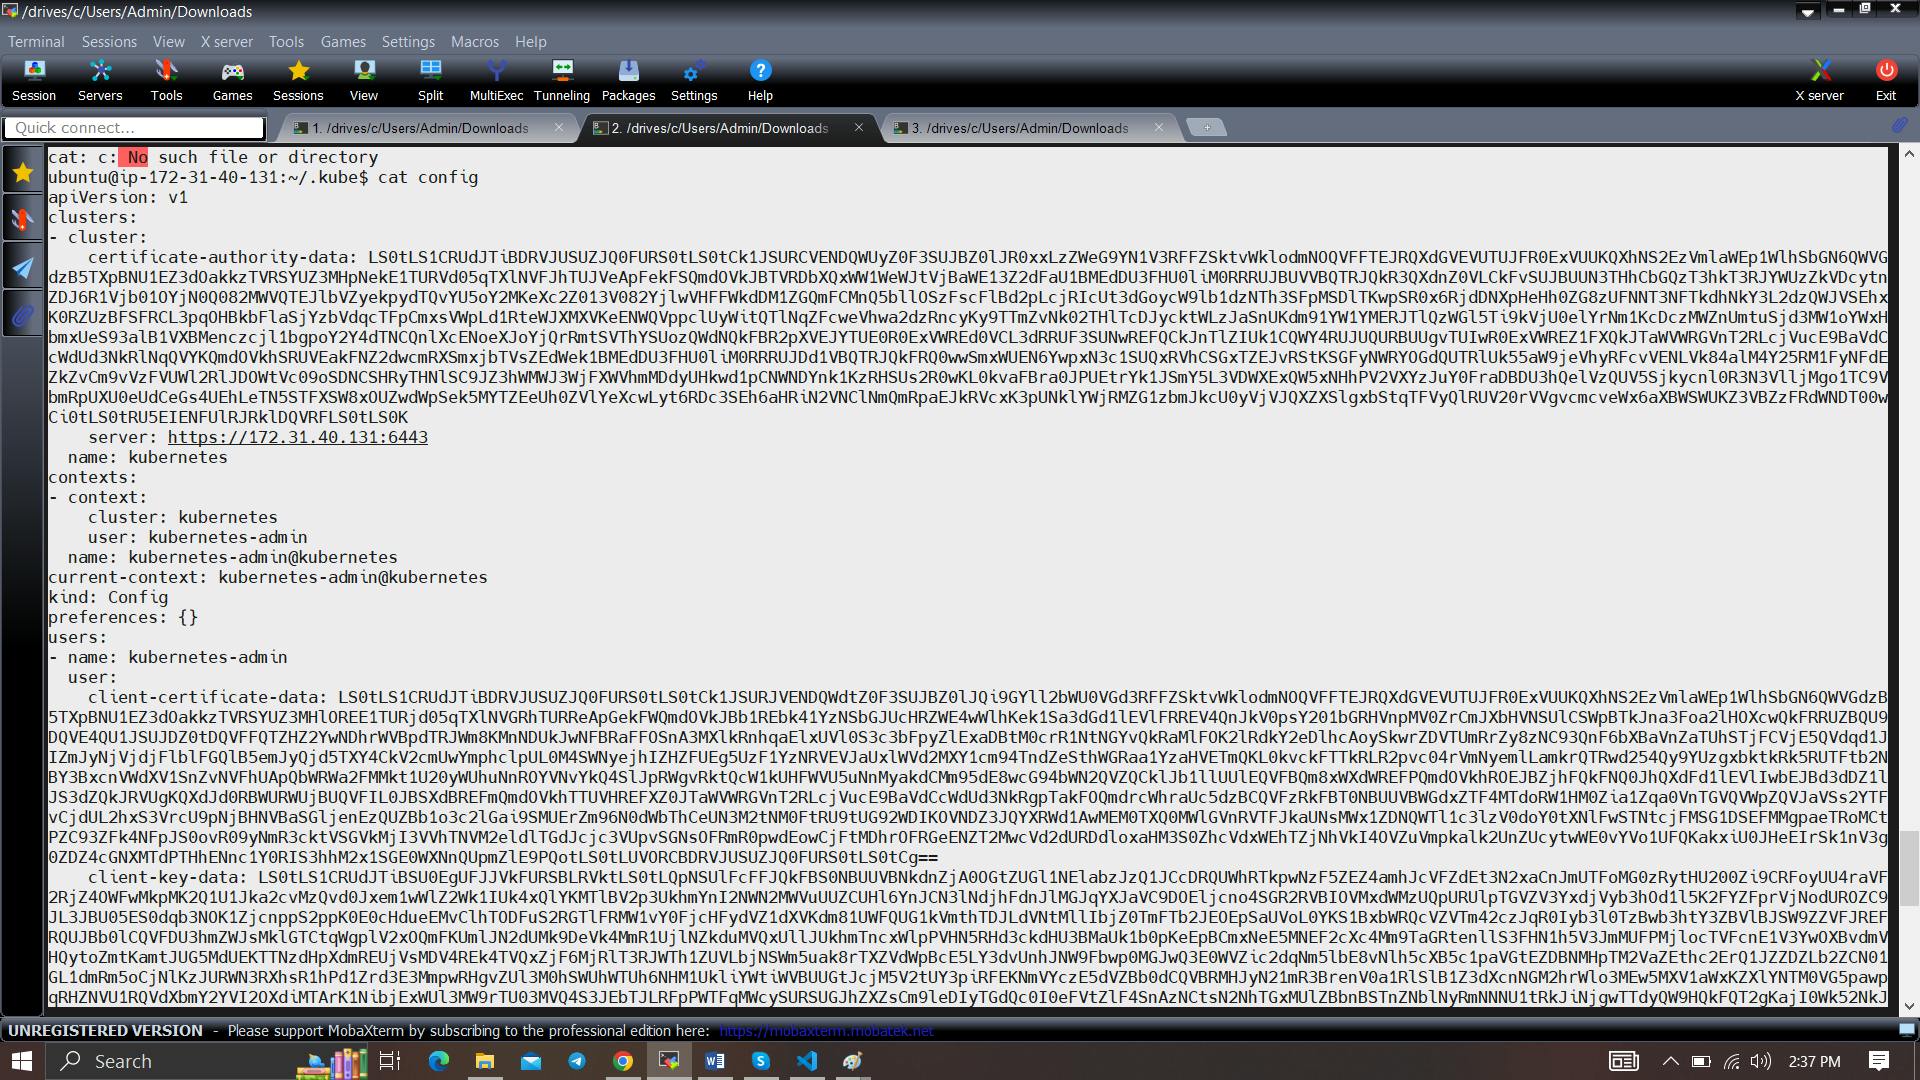
copy it and save it in documents or another folder save it as secret-file.txt
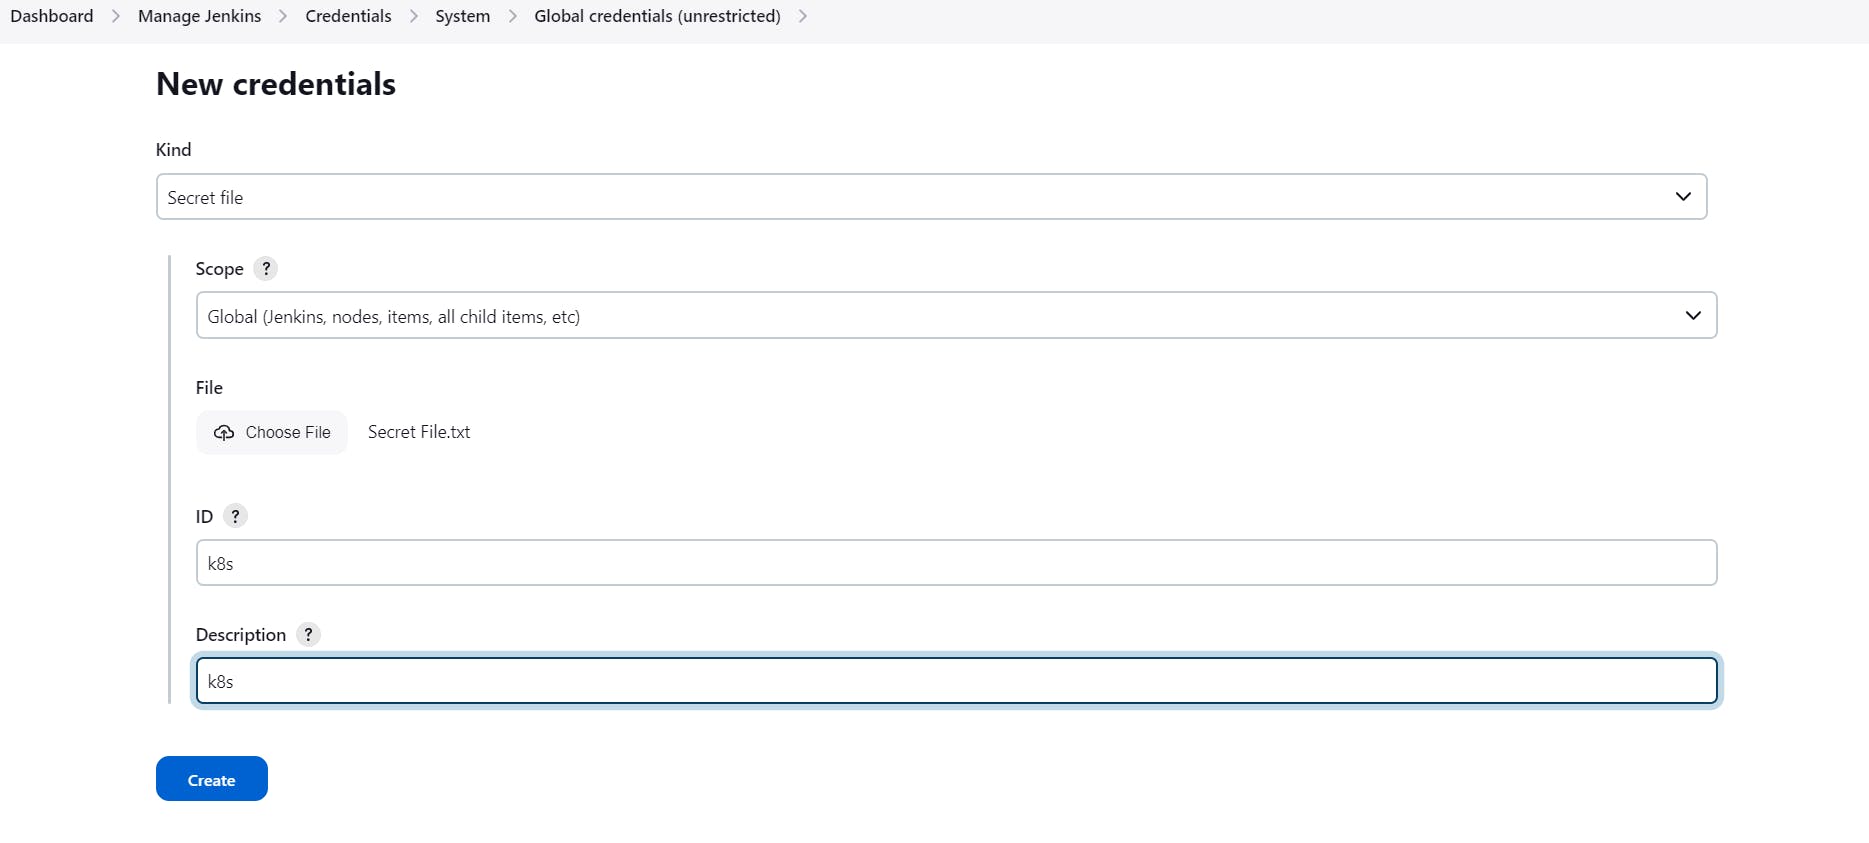
Note: create a secret-file.txt in your file explorer save the config in it and use this at the Kubernetes credential section.
Install Kubernetes Plugin, Once it’s installed successfully:-
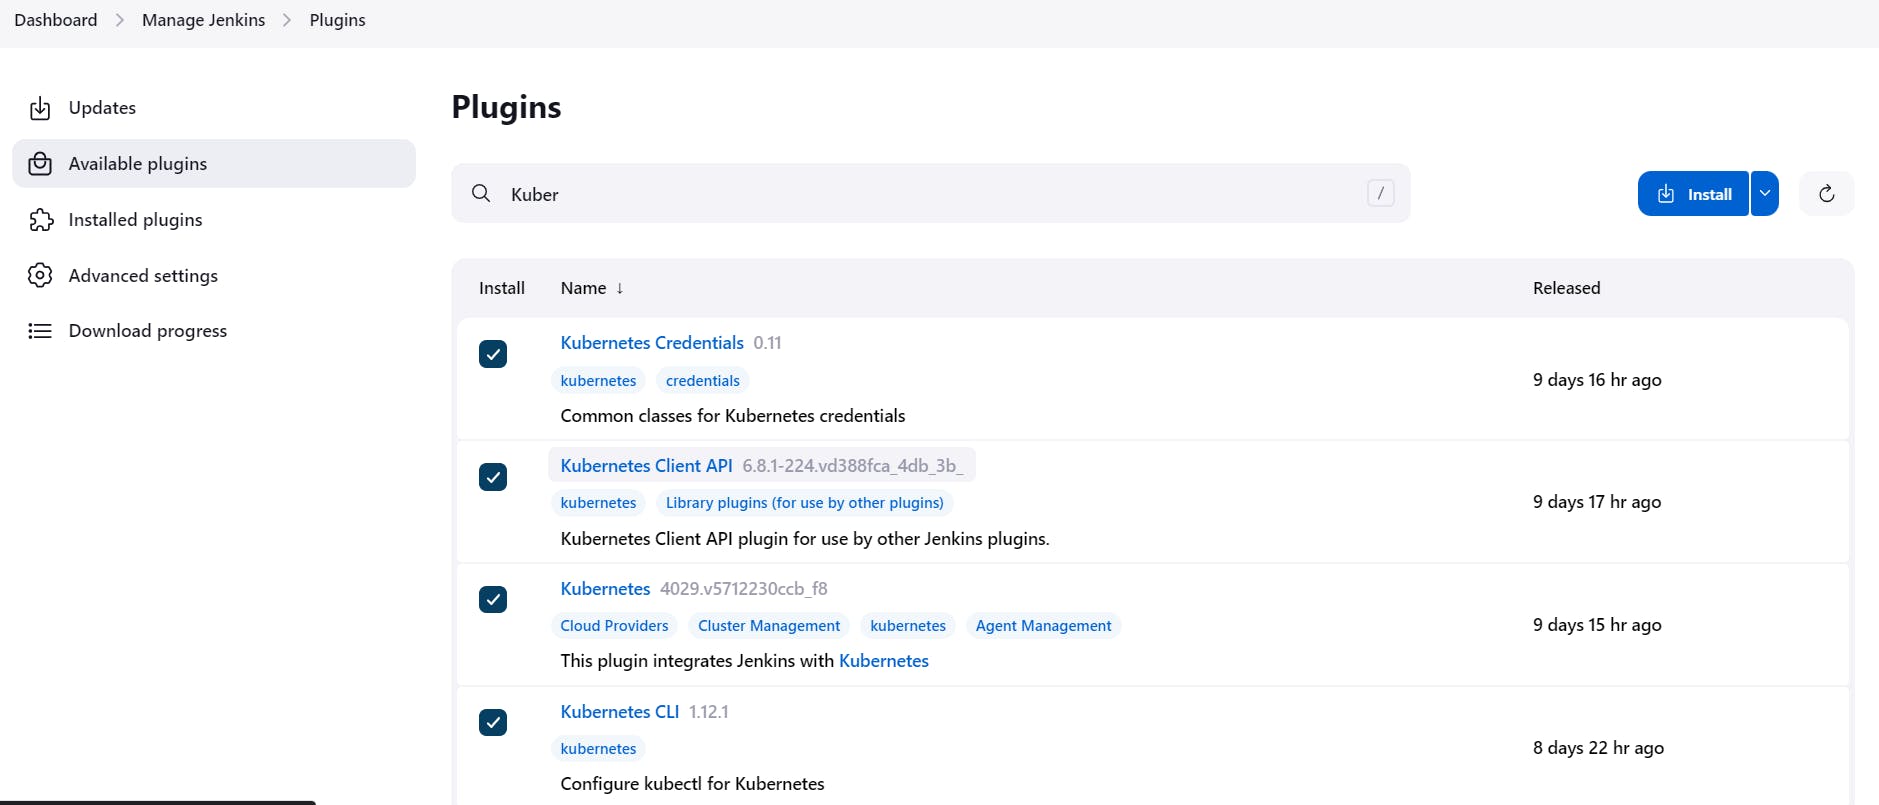
goto manage Jenkins –> manage credentials –> Click on Jenkins global –> add credentials
Now, Install Node_exporter on both master and worker servers
Let’s add Node_exporter on Master and Worker to monitor the metrics
First, let’s create a system user for Node Exporter by running the following command:-
sudo useradd \
    --system \
    --no-create-home \
    --shell /bin/false node_exporter

Use the wget command to download the binary:-
wget https://github.com/prometheus/node_exporter/releases/download/v1.6.1/node_exporter-1.6.1.linux-amd64.tar.gz

Extract the node exporter from the archive:-
tar -xvf node_exporter-1.6.1.linux-amd64.tar.gz

Move binary to the /usr/local/bin:-
sudo mv \
  node_exporter-1.6.1.linux-amd64/node_exporter \
  /usr/local/bin/

Verify that you can run the binary:-
node_exporter --version

Node Exporter has a lot of plugins that we can enable. If you run Node Exporter help you will get all the options:-
node_exporter --help
–collector.logind We’re going to enable the login controller, just for the demo.
Next, create a similar systemd unit file:-
sudo vi /etc/systemd/system/node_exporter.service

node_exporter.service
[Unit]
Description=Node Exporter
Wants=network-online.target
After=network-online.target
StartLimitIntervalSec=500
StartLimitBurst=5

[Service]
User=node_exporter
Group=node_exporter
Type=simple
Restart=on-failure
RestartSec=5s
ExecStart=/usr/local/bin/node_exporter \
    --collector.logind

[Install]
WantedBy=multi-user.target

Replace Prometheus user and group to node_exporter, and update the ExecStart command.
To automatically start the Node Exporter after reboot, enable the service:-
sudo systemctl enable node_exporter
Then start the Node Exporter:-
sudo systemctl start node_exporter

Check the status of Node Exporter with the following command:-
sudo systemctl status node_exporter

If you have any issues, check logs with journalctl :-
journalctl -u node_exporter -f --no-pager
At this point, we have only a single target in our Prometheus. There are many different service discovery mechanisms built into Prometheus. For example, Prometheus can dynamically discover targets in AWS, GCP, and other clouds based on the labels. In the following tutorials, I’ll give you a few examples of deploying Prometheus in a cloud-specific environment. For this tutorial, let’s keep it simple and keep adding static targets. Also, I have a lesson on how to deploy and manage Prometheus in the Kubernetes cluster.
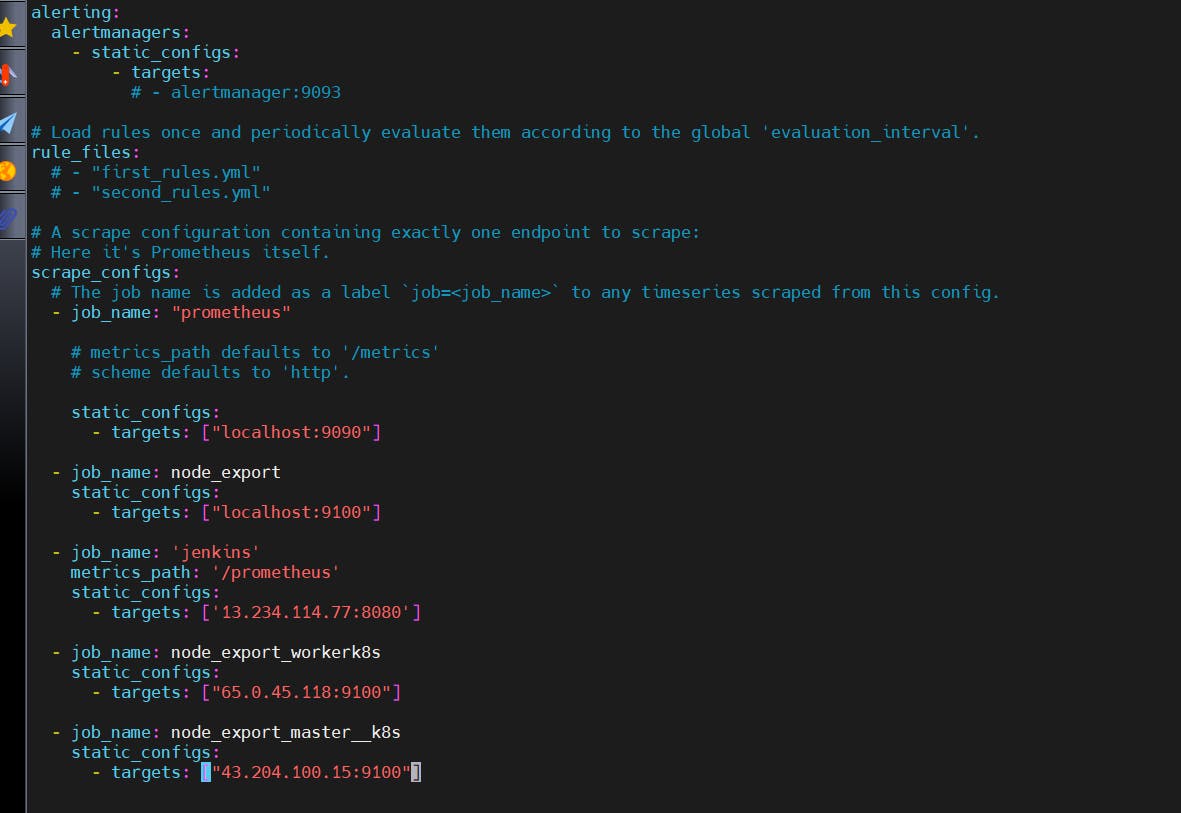
To create a static target, you need to add job_name with static_configs. Go to Prometheus server:-
sudo vi /etc/prometheus/prometheus.yml
prometheus.yml
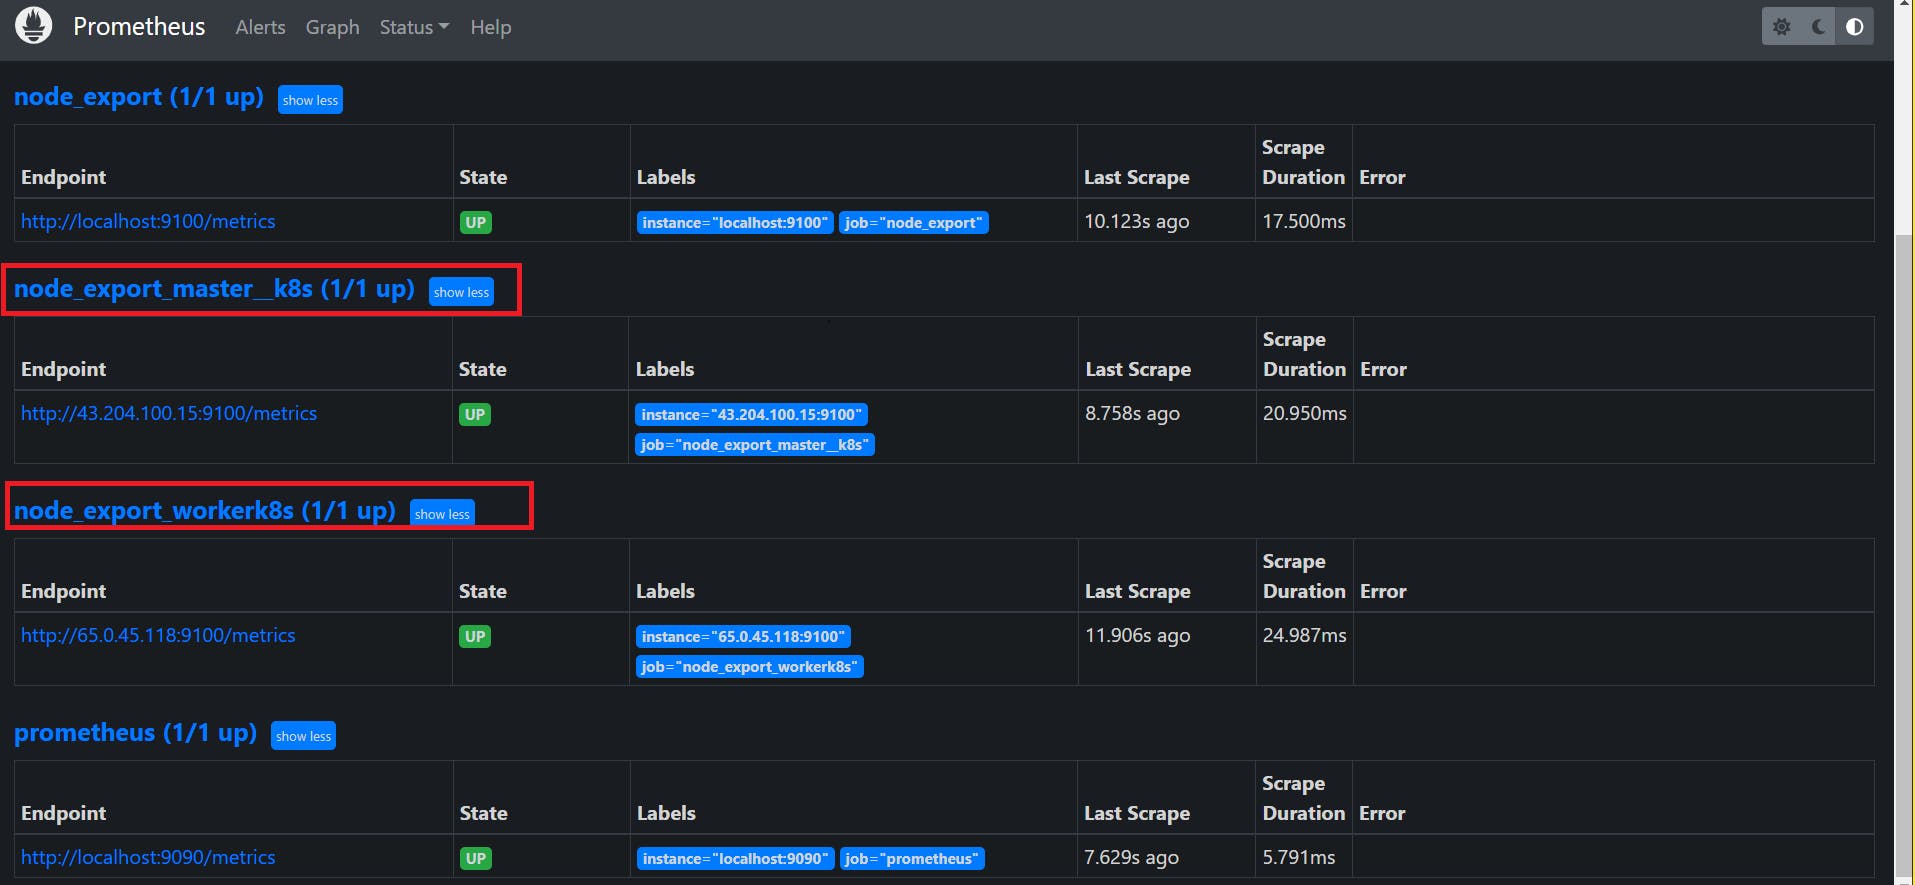
- job_name: node_export_masterk8s
    static_configs:
      - targets: ["<master-ip>:9100"]
  - job_name: node_export_workerk8s
    static_configs:
      - targets: ["<worker-ip>:9100"]
By default, Node Exporter will be exposed on port 9100:-
Since we enabled lifecycle management via API calls, we can reload the Prometheus config without restarting the service and causing downtime.
Before, restarting check if the config is valid or not:-
promtool check config /etc/prometheus/prometheus.yml
Then, you can use a POST request to reload the config:-
curl -X POST http://localhost:9090/-/reload
Check the targets section:-
http://<public_ip>:9090/targets
final step to deploy on the Kubernetes Cluster:-
stage('Deploy to kubernets'){
            steps{
                script{
                    dir('Kubernetes') {
                        withKubeConfig(caCertificate: '', clusterName: '', contextName: '', credentialsId: 'k8s', namespace: '', restrictKubeConfigAccess: false, serverUrl: '') {
                                sh 'kubectl apply -f deployment.yml'
                                sh 'kubectl apply -f service.yml'
                        }
                    }
                }
            }
        }
In the Kubernetes cluster(Master Server) give this command:-
kubectl get all
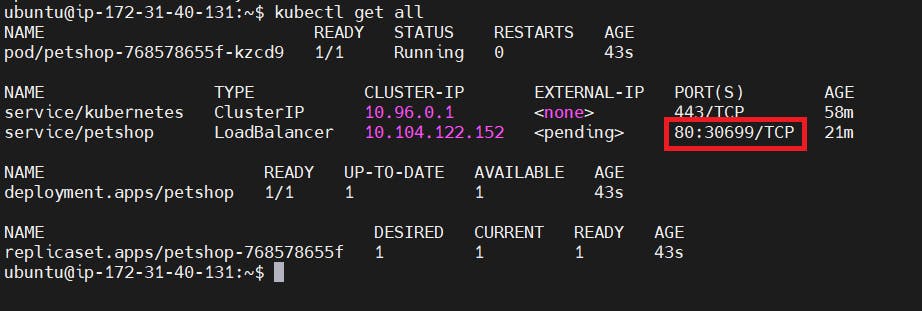
Step 13:- Access the Netflix app on the Browser.
<public-ip-of-k8s-slave:service port>
output:

Step 14:- Terminate the AWS EC2 Instances.
Full steps of CI/CD Pipeline Below👇
CI/CD Pipeline:-
pipeline{
    agent any
    tools{
        jdk 'jdk17'
        nodejs 'node16'
    }
    environment {
        SCANNER_HOME=tool 'sonar-scanner'
    }
    stages {
        stage('clean workspace'){
            steps{
                cleanWs()
            }
        }
        stage('Checkout from Git'){
            steps{
                git branch: 'main', url: 'your_github_URL_here'
            }
        }
        stage("Sonarqube Analysis "){
            steps{
                withSonarQubeEnv('sonar-server') {
                    sh ''' $SCANNER_HOME/bin/sonar-scanner -Dsonar.projectName=Application \
                    -Dsonar.projectKey=Application '''  # you can change the name and key here as per ypur choice
                }
            }
        }
        stage("quality gate"){
           steps {
                script {
                    waitForQualityGate abortPipeline: false, credentialsId: 'Sonar-token'
                }
            }
        }
        stage('Install Dependencies') {
            steps {
                sh "npm install"
            }
        }
        stage('OWASP FS SCAN') {
            steps {
                dependencyCheck additionalArguments: '--scan ./ --disableYarnAudit --disableNodeAudit', odcInstallation: 'DP-Check'
                dependencyCheckPublisher pattern: '**/dependency-check-report.xml'
            }
        }
        stage('TRIVY FS SCAN') {
            steps {
                sh "trivy fs . > trivyfs.txt"
            }
        }
        stage("Docker Build & Push"){
            steps{
                script{
                   withDockerRegistry(credentialsId: 'docker', toolName: 'docker'){
                       sh "docker build --build-arg TMDB_V3_API_KEY=<API-key> -t netflix ."
                       sh "docker tag netflix yash5090/netflix:latest "
                       sh "docker push yash5090/netflix:latest "
                    }
                }
            }
        }
        stage("TRIVY"){
            steps{
                sh "trivy image yash5090/netflix:latest > trivyimage.txt"
            }
        }
        stage('Deploy to container'){
            steps{
                sh 'docker run -d --name netflix -p 8081:80 yash5090/netflix:latest'
            }
        }
        stage('Deploy to kubernets'){
            steps{
                script{
                    dir('Kubernetes') {
                        withKubeConfig(caCertificate: '', clusterName: '', contextName: '', credentialsId: 'k8s', namespace: '', restrictKubeConfigAccess: false, serverUrl: '') {
                                sh 'kubectl apply -f deployment.yml'
                                sh 'kubectl apply -f service.yml'
                        }
                    }
                }
            }
        }
    }
    post {
     always {
        emailext attachLog: true,
            subject: "'${currentBuild.result}'",
            body: "Project: ${env.JOB_NAME}<br/>" +
                "Build Number: ${env.BUILD_NUMBER}<br/>" +
                "URL: ${env.BUILD_URL}<br/>",
            to: 'your_mail_id@gmail.com',
            attachmentsPattern: 'trivyfs.txt,trivyimage.txt'
        }
    }
}


